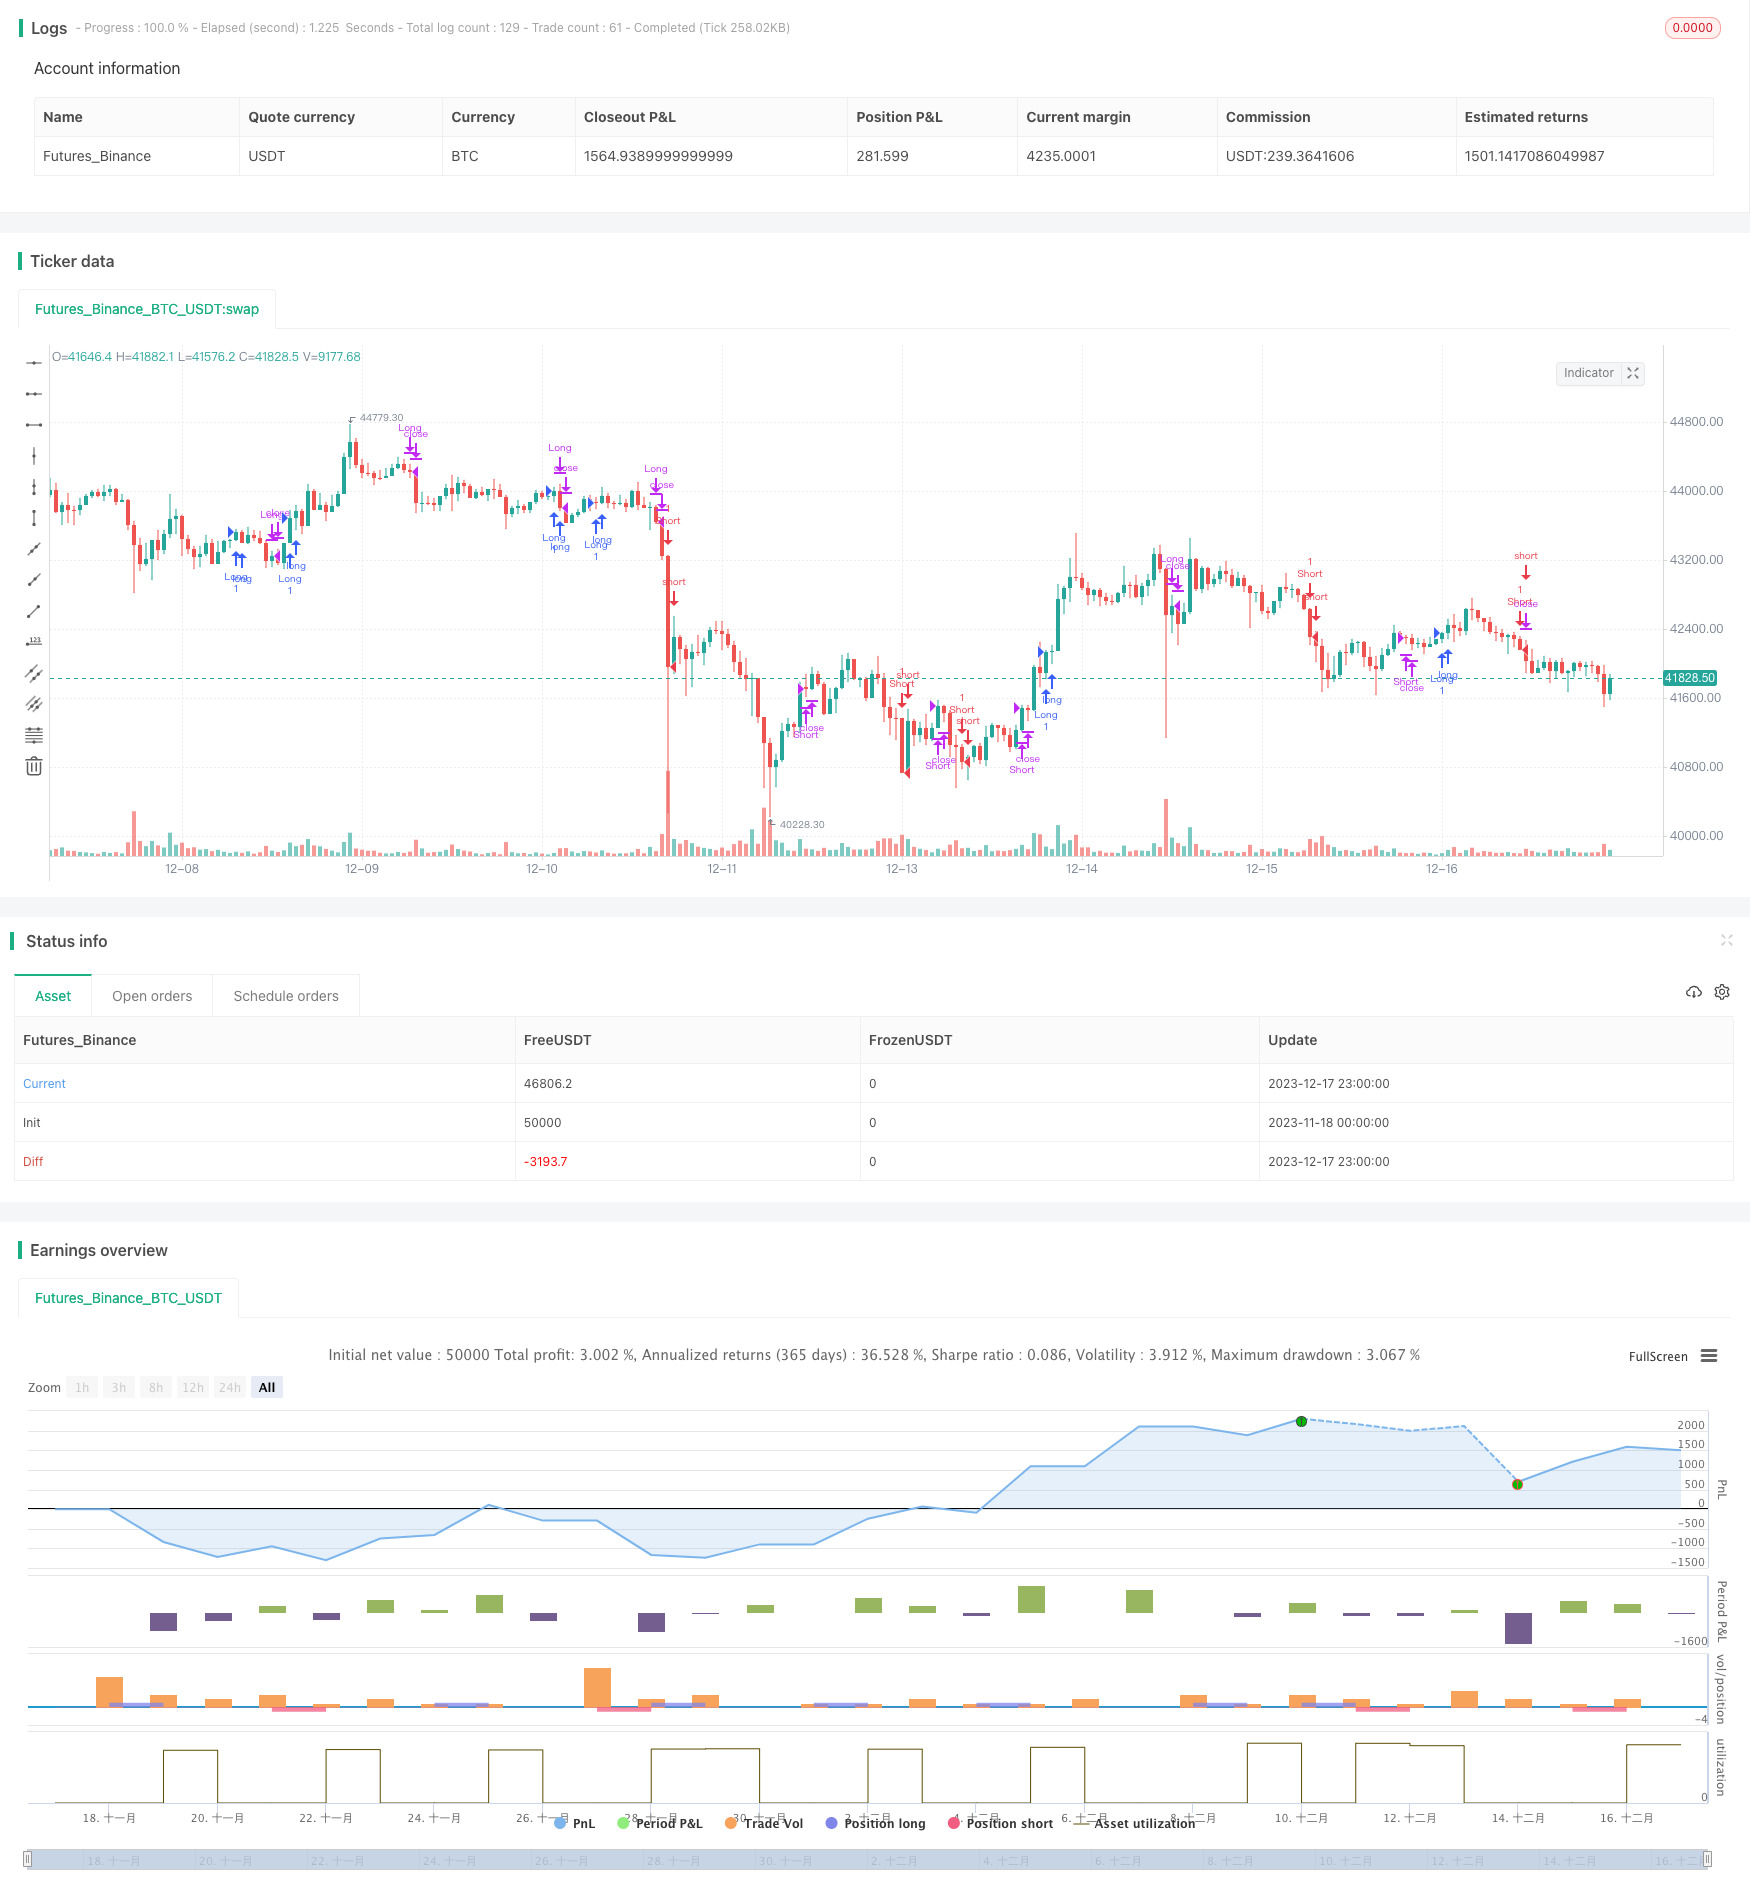
개요
MACD 트렌드 추적 단선 전략은 이동 평균, MACD 지표 및 윌리엄 지표를 결합한 단선 거래 전략이다. 이 전략은 3가지 지표의 다른 조합을 사용하여 다공개 포지션의 입출입 조건을 형성하여 단선 가격의 경향성을 포착한다.
전략 원칙
이 전략의 주요 거래 논리는 다음과 같습니다.
가격 상승이 기하급수적인 이동 평균 (EMA) 의 평균을 통과할 때 더 많이 보고, 가격 하락이 지나갈 때 더 많이 보고;
MACD의 패스트 라인이 패스트 라인보다 높을 때 더 보고, 패스트 라인이 패스트 라인보다 낮을 때 더 보고;
윌리엄스 지표의 빠른 이동 평균이 느린 이동 평균보다 높을 때 더 많이 볼 수 있고, 반대로 덜 볼 수 있습니다.
이 세 가지 조건의 조합으로 입학을 결정하는 것.
역으로 판단하면 출전한다.
EMA는 큰 트렌드 방향을 판단하고 MACD는 단기 가격 동력을 판단함으로써, 이 전략은 좋은 입구 지점에서 가격의 트렌드 특성을 포착하여 수익을 창출할 수 있다. 윌리엄 지표는 가짜 돌파구를 피하기 위해 품종의 과매매를 추가로 검증하는 데 사용할 수 있다.
전략적 이점
이 다중 지표 조합 구조는 전형적인 단선 트렌드 추적 전략이며, 다음과 같은 장점이 있습니다:
세 가지 지표가 서로 검증되어 잘못된 신호의 가능성을 줄일 수 있습니다.
EMA는 주류의 방향을 판단하고, MACD는 단선 동력이 강하다고 판단합니다.
하지만, 이 지표는 한 변동에 따라 상승과 하락을 피하고 있습니다.
리버스 지표 포트폴리오 판단 탈퇴, 위험 제어와 밀접하게 결합
전략적 위험
이 전략에는 다음과 같은 주요 위험도 있습니다.
다중 지표 조합 구조는 복잡하고, 매개 변수 조정의 난이도가 크다.
거래 비용의 높은 경우와 짧은 전화가 자주 발생하는 경우;
하지만, 이 모든 것은, 이 모든 것은, 이 모든 것은, 이 모든 것은, 이 모든 것은, 이 모든 것은, 이 모든 것은.
대책은 주로 변수 조정 및 중지 측면에서 최적의 변수 조합을 찾고, 적절한 중지 수준을 설정하여 단일 거래의 최대 손실을 제어한다.
전략 최적화 방향
이 전략은 다음의 몇 가지 측면에서 최적화될 수 있습니다.
더 많은 조합을 테스트하여 최적의 조건을 찾아보세요.
이 자료를 통해, 우리는 더 많은 자료를 얻을 수 있습니다.
동적 상쇄 또는 추적 상쇄를 설정하여 위험 통제를 강화합니다.
기계학습 모델과 결합하여 실제 트렌드 전환점을 판단하는 것.
요약하다
MACD 트렌드 추적 단선 전략은 여러 지표의 통합 사용의 장점을 가지고 단선 트렌드를 판단하는 동시에 위험을 제어한다. 변수 최적화, 스톱 로즈 레벨 설정 및 더 많은 데이터 소스의 도입을 통해 전략의 승률과 수익 수준을 더욱 향상시킬 수 있다. 이 전략 아이디어는 더 확장하고 심층적인 연구를 할 가치가 있다.
/*backtest
start: 2023-11-18 00:00:00
end: 2023-12-18 00:00:00
period: 1h
basePeriod: 15m
exchanges: [{"eid":"Futures_Binance","currency":"BTC_USDT"}]
*/

// This source code is subject to the terms of the Mozilla Public License 2.0 at https://mozilla.org/MPL/2.0/
// © platsn

//@version=5
strategy("MACD Willy Strategy", overlay=true, pyramiding=1, initial_capital=10000)

// ******************** Trade Period **************************************
startY = input(title='Start Year', defval=2011, group = "Trading window")
startM = input.int(title='Start Month', defval=1, minval=1, maxval=12, group = "Trading window")
startD = input.int(title='Start Day', defval=1, minval=1, maxval=31, group = "Trading window")
finishY = input(title='Finish Year', defval=2050, group = "Trading window")
finishM = input.int(title='Finish Month', defval=12, minval=1, maxval=12, group = "Trading window")
finishD = input.int(title='Finish Day', defval=31, minval=1, maxval=31, group = "Trading window")
timestart = timestamp(startY, startM, startD, 00, 00)
timefinish = timestamp(finishY, finishM, finishD, 23, 59)
// t1 = time(timeframe.period, "0945-1545:23456")
// window = time >= timestart and time <= timefinish and t1 ? true : false
// t2 = time(timeframe.period, "0930-1555:23456")
// window2 = time >= timestart and time <= timefinish and t2 ? true : false

leverage = input.float(1, title="Leverage (if applicable)", step=0.1, group = "Trading Options")
reinvest = input.bool(defval=false,title="Reinvest profit", group = "Trading Options")
reinvest_percent = input.float(defval=20, title = "Reinvest percentage", group="Trading Options")
// entry_lookback = input.int(defval=10, title="Lookback period for entry condition", group = "Trading Options")

// -------------------------------------------- Data Source --------------------------------------------

src = input(title="Source", defval=close)

// ***************************************************************************************************** Daily ATR *****************************************************
atrlen = input.int(14, minval=1, title="ATR period", group = "Daily ATR")
iPercent = input.float(5, minval=1, maxval=100, step=0.1, title="% ATR to use for SL / PT", group = "Daily ATR")

percentage = iPercent * 0.01
datr = request.security(syminfo.tickerid, "1D", ta.rma(ta.tr, atrlen))
datrp = datr * percentage

// plot(datr,"Daily ATR")
// plot(datrp, "Daily % ATR")

//*********************************************************** VIX volatility index ****************************************

VIX = request.security("BTC_USDT:swap", timeframe.period, close)
vix_thres = input.float(20.0, "VIX Threshold for entry", step=0.5, group="VIX Volatility Index")

// ************************************************ Volume ******************************************************

vol_len = input(50, 'Volume MA Period')
avg_vol = ta.sma(volume, vol_len)

//-------------------------------------------------------- Moving Average ------------------------------------

emalen1 = input.int(200, minval=1, title='EMA', group= "Moving Averages")
ema1 = ta.ema(src, emalen1)

// ------------------------------------------ MACD ------------------------------------------
// Getting inputs
fast_length = input(title="Fast Length", defval=12)
slow_length = input(title="Slow Length", defval=26)
signal_length = input.int(title="Signal Smoothing",  minval = 1, maxval = 50, defval = 9)
sma_source = input.string(title="Oscillator MA Type",  defval="EMA", options=["SMA", "EMA"])
sma_signal = input.string(title="Signal Line MA Type", defval="EMA", options=["SMA", "EMA"])
// Plot colors
col_macd = input(#2962FF, "MACD Line  ", group="Color Settings", inline="MACD")
col_signal = input(#FF6D00, "Signal Line  ", group="Color Settings", inline="Signal")
col_grow_above = input(#26A69A, "Above   Grow", group="Histogram", inline="Above")
col_fall_above = input(#B2DFDB, "Fall", group="Histogram", inline="Above")
col_grow_below = input(#FFCDD2, "Below Grow", group="Histogram", inline="Below")
col_fall_below = input(#FF5252, "Fall", group="Histogram", inline="Below")
// Calculating
fast_ma = sma_source == "SMA" ? ta.sma(src, fast_length) : ta.ema(src, fast_length)
slow_ma = sma_source == "SMA" ? ta.sma(src, slow_length) : ta.ema(src, slow_length)
macd = fast_ma - slow_ma
signal = sma_signal == "SMA" ? ta.sma(macd, signal_length) : ta.ema(macd, signal_length)
hist = macd - signal

// ---------------------------------------- William %R --------------------------------------
w_length = input.int(defval=34, minval=1)
w_upper = ta.highest(w_length)
w_lower = ta.lowest(w_length)

w_output = 100 * (close - w_upper) / (w_upper - w_lower)

fast_period = input(defval=5, title='Smoothed %R Length')
slow_period = input(defval=13, title='Slow EMA Length')

w_fast_ma = ta.wma(w_output,fast_period)
w_slow_ma = ta.ema(w_output,slow_period)


// ------------------------------------------------ Entry Conditions ----------------------------------------

L_entry1 = close > ema1 and hist > 0 and w_fast_ma > w_slow_ma
S_entry1 = close < ema1 and hist < 0 and w_fast_ma < w_slow_ma

// -------------------------------------------------- Entry -----------------------------------------------
strategy.initial_capital = 50000
profit = strategy.netprofit
trade_amount = math.floor(strategy.initial_capital*leverage / close)

if strategy.netprofit > 0 and reinvest
    trade_amount := math.floor((strategy.initial_capital+(profit*reinvest_percent*0.01))*leverage / close)
else
    trade_amount := math.floor(strategy.initial_capital*leverage/ close)


if L_entry1 //and window
    strategy.entry("Long", strategy.long, trade_amount)

if S_entry1 //and window
    strategy.entry("Short", strategy.short, trade_amount)

// --------------------------------------------------- Exit Conditions -------------------------------------

L_exit1 = hist < 0 and w_fast_ma < w_slow_ma and w_fast_ma < -20
S_exit1 = hist > 0 and w_fast_ma > w_slow_ma and w_fast_ma > -80

// ----------------------------------------------------- Exit ---------------------------------------------

if L_exit1 //and window2
    strategy.close("Long")

if S_exit1 //and window2
    strategy.close("Short")

// if time(timeframe.period, "1530-1600:23456")
//     strategy.close_all()