개요
이 전략은 Heikin-Ashi 선, 평형 K 선의 가격을 계산하여 MACD 지표와 결합하여 거래 신호를 발산하여 중장선 추세를 추적하는 정량화 거래 전략을 구현합니다.
전략 원칙
Heikin-Ashi 개시 가격, 폐시 가격, 최고 가격, 최저 가격을 계산하고, Heikin-Ashi 선을 그리며, K 선의 가격 움직임을 평평하게 한다.
MACD 파라미터를 설정합니다: 빠른 선 길이는 12, 느린 선 길이는 26, 신호 선 길이는 9 .
DEA 느린선, DEA 빠른선, MACD 차원을 계산한다. MACD 기둥 모양의 도면을 그리는다.
MACD 차이는 0이 될 때, 더 많은 것을; MACD 차이는 0이 될 때, 공백을 다.
연, 달, 일 필터링 조건을 설정하여 지정된 시간 동안만 거래하십시오.
우위 분석
Heikin-Ashi 선은 시장의 소음을 효과적으로 어내고, 트렌드를 식별한다.
MACD는 좀 더 명확한 트렌드 구매/판매 지점을 제공합니다.
Heikin-Ashi와 MACD를 결합하면 거래소 품질을 높이고 수익성있는 거래를 증가시킬 수 있습니다.
시간 필터 조건을 설정하여, 역사적 데이터 회귀를 통해 최적의 거래 시간을 결정하여, 수익률을 높일 수 있습니다.
위험 분석
이 추세에 따른 손실이 더 커질 수 있습니다.
MACD 파라미터가 잘못 설정되어 너무 많은 무효 신호를 생성할 수 있다.
시간 필터링 조건이 너무 엄격하여 더 좋은 거래 기회를 놓칠 수 있습니다.
대책:
단편적 손실을 제어하기 위해 Stop Loss Stop를 설정합니다.
MACD 변수를 최적화하여 최적의 변수 조합을 결정한다.
다른 지표와 함께 지역적 추세를 판단한다.
최적화 방향
다양한 변수 조합을 테스트하여 최적의 변수를 찾습니다.
손해 방지 장치를 추가합니다. 예를 들어, 손해 방지 / 추적 방지.
EMA, KDJ 등의 지표와 함께 판단하는 전환점.
양에너지 지표를 추가하고 양에너지 분화를 피한다.
요약하다
이 전략은 Heikin-Ashi 선 평면 가격을 계산하여 MACD Tradingview 지표와 함께 트렌드 방향을 판단하고 입점 지점을 결정하여 트렌드 추적을 기반으로 한 정량화 전략을 구현합니다. 일반 MACD 전략과 비교하여 가격 곡선을 평형화하고 일부 잡음을 필터링하여 트렌드 방향을 더 명확하게 판단 할 수 있습니다. 파라미터 최적화, 스톱 스탠드 메커니즘 및 기타 지표의 조합으로 전략의 안정성과 수익성을 더욱 강화 할 수 있습니다.
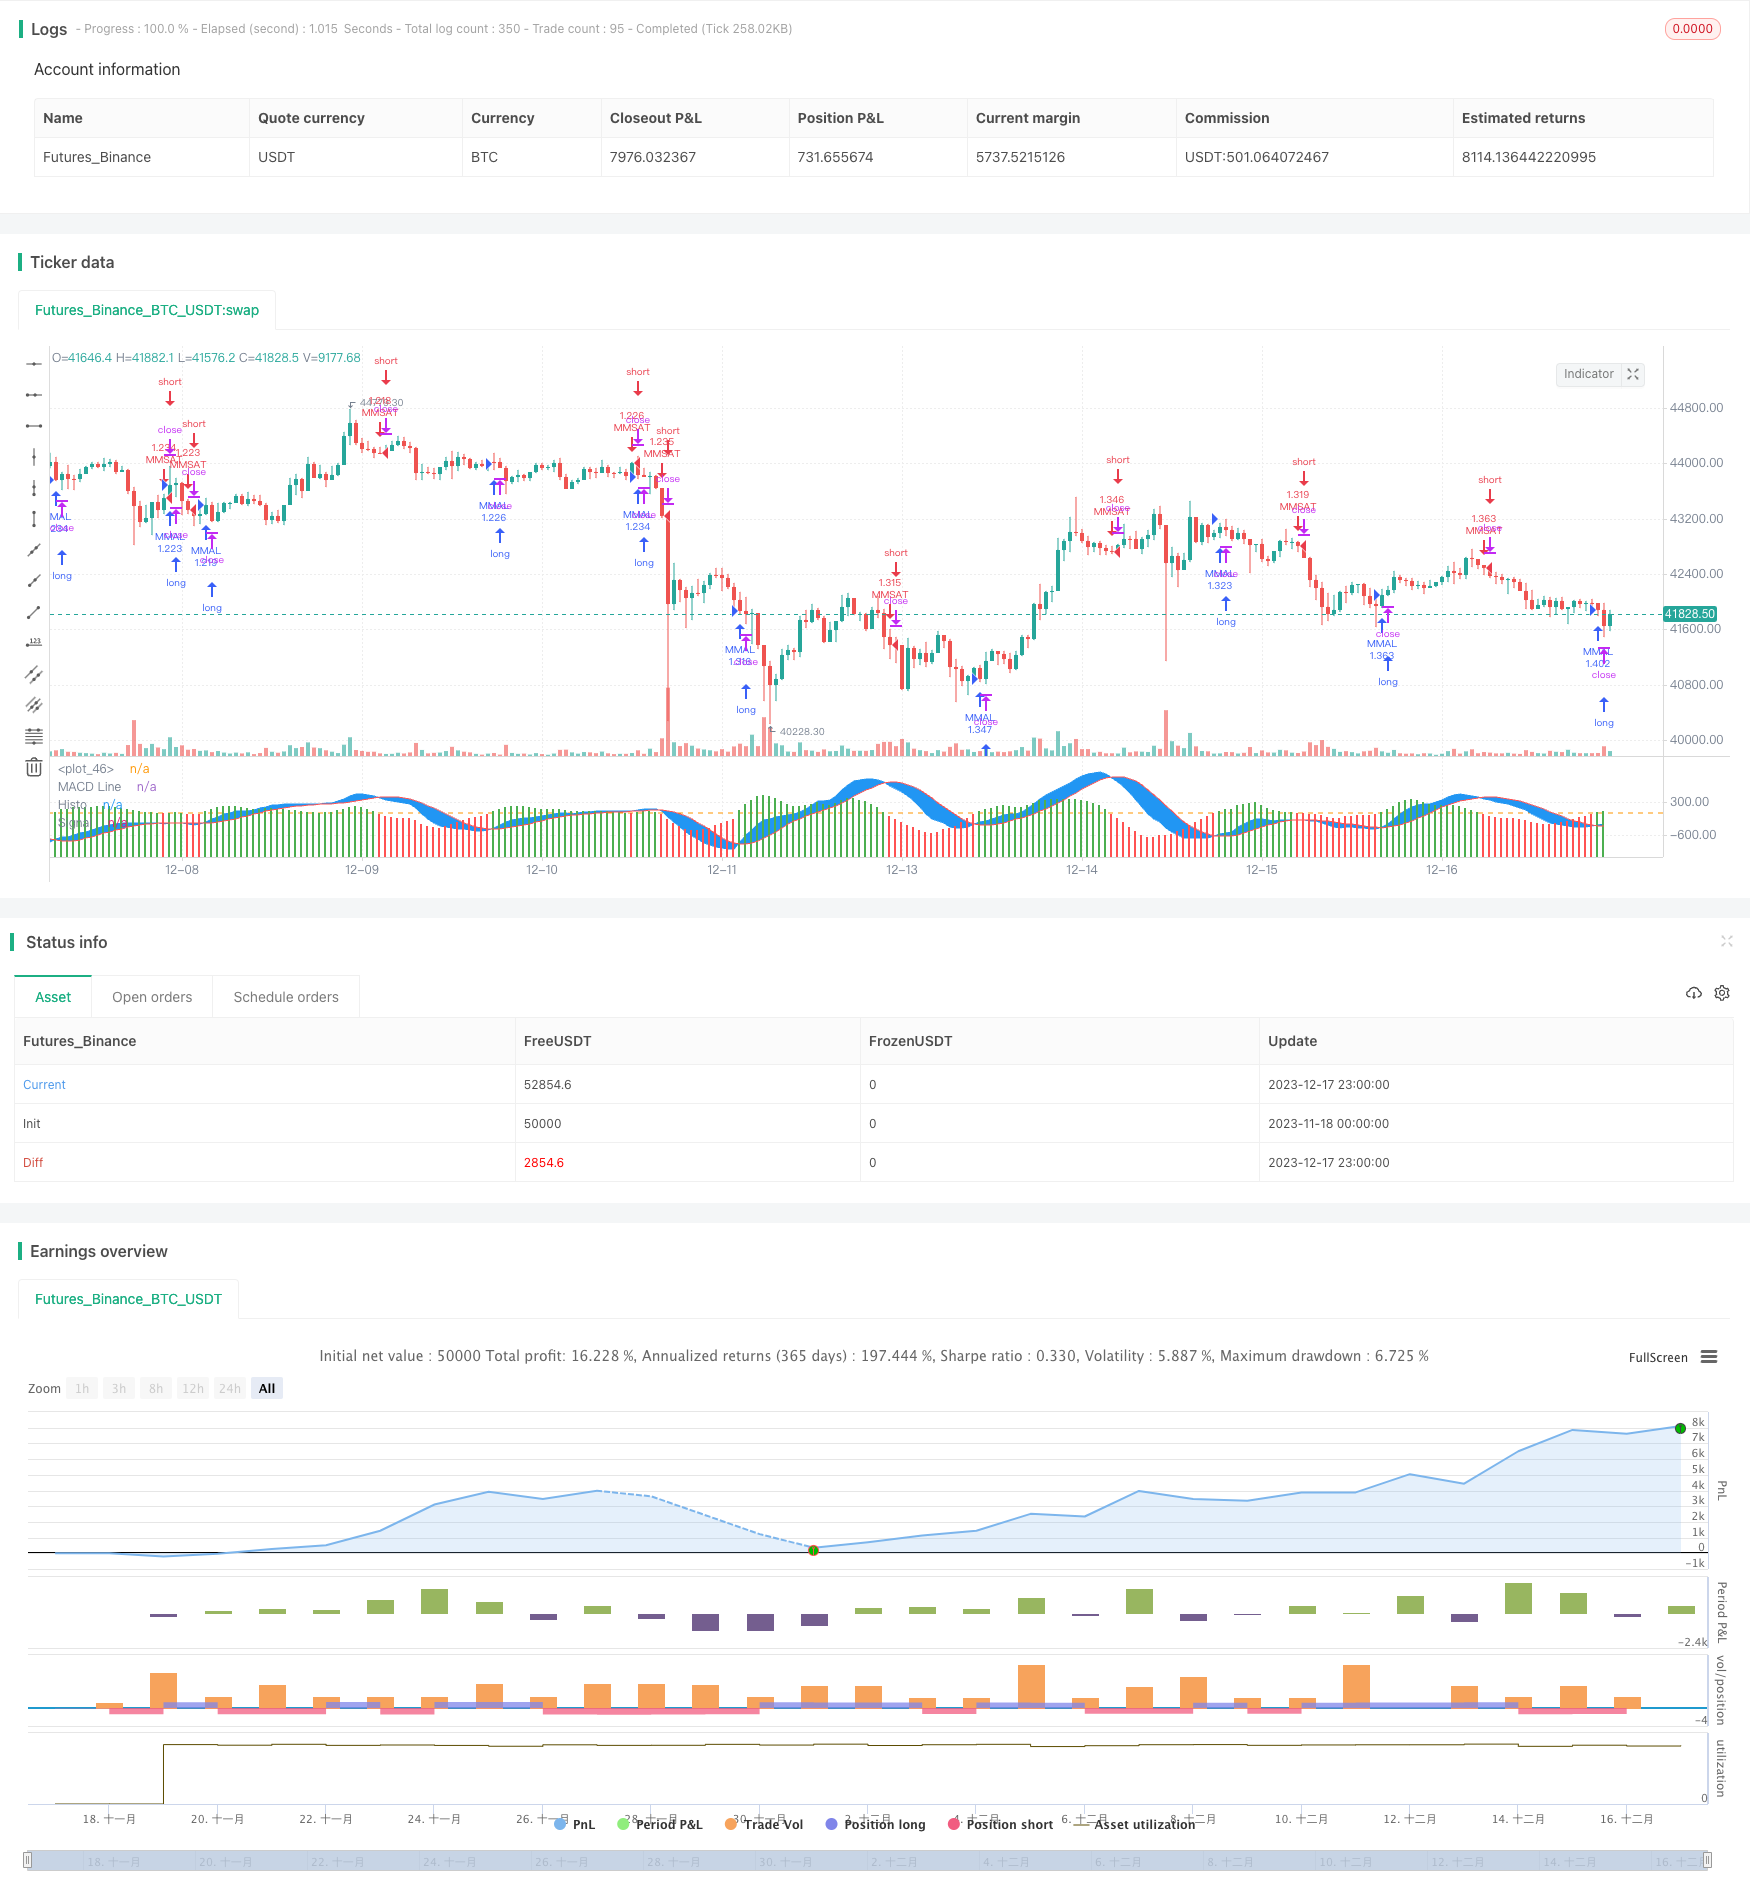
/*backtest
start: 2023-11-18 00:00:00
end: 2023-12-18 00:00:00
period: 1h
basePeriod: 15m
exchanges: [{"eid":"Futures_Binance","currency":"BTC_USDT"}]
*/

//@version=4
strategy("MACD ASHI BARS .v1 ", overlay=false,default_qty_type = strategy.percent_of_equity, default_qty_value = 100,commission_type=strategy.commission.percent,commission_value=0.1,slippage=1)

// Calculation HA Values
haopen  = 0.0
haclose = (open + high + low + close) / 4
haopen := na(haopen[1]) ? (open + close) / 2 : (haopen[1] + haclose[1]) / 2
hahigh  = max(high, max(haopen, haclose))
halow   = min(low,  min(haopen, haclose))

// HA colors
hacolor = haclose > haopen ? color.green : color.red
src=haclose


fastmacd = input(12,title='MACD Fast  Line Length')
slowmacd = input(26,title='MACD Slow Line Length')
signalmacd = input(9,title='Signal Line Length')

macdslowline1 = sma(src,slowmacd)
macdslowline2 = sma(macdslowline1,slowmacd)
DEMAslow = ((2 * macdslowline1) - macdslowline2 )

macdfastline1 = sma(src,fastmacd)
macdfastline2 = sma(macdfastline1,fastmacd)
DEMAfast = ((2 * macdfastline1) - macdfastline2)

MACDLine = (DEMAfast - DEMAslow)

SignalLine = sma(MACDLine, signalmacd)

delta = MACDLine-SignalLine


swap1 = delta>0?color.green:color.red


plot(delta,color=swap1,style=plot.style_columns,title='Histo',histbase=0,transp=20)
p1 = plot(MACDLine,color=color.blue,title='MACD Line')
p2 = plot(SignalLine,color=color.red,title='Signal')
fill(p1, p2, color=color.blue)
hline(0)


yearfrom = input(2020)
yearuntil =input(2042)
monthfrom =input(1)
monthuntil =input(12)
dayfrom=input(1)
dayuntil=input(31)


if ( crossover(delta,0)  and   year >= yearfrom and year <= yearuntil and month>=monthfrom and month <=monthuntil and dayofmonth>=dayfrom and dayofmonth < dayuntil)
    strategy.entry("MMAL", strategy.long, stop=close, oca_name="TREND",  comment="AL")

else
    strategy.cancel(id="MMAL")


if (  crossunder(delta,0) and  year >= yearfrom and year <= yearuntil and month>=monthfrom and month <=monthuntil and dayofmonth>=dayfrom and dayofmonth < dayuntil )

    strategy.entry("MMSAT", strategy.short,stop=close, oca_name="TREND",  comment="SAT")
else
    strategy.cancel(id="MMSAT")