볼린저 밴드 RSI 지표의 CCI 이동평균선 교차 전략

개요
본 전략은 볼린저 밴드, 상대강도지수(RSI) 및 상품경로지수(CCI)의 세 가지 지표를 결합하여 교차 신호를 찾고 매수 및 매도 신호를 발생시킵니다. 이 전략은 시장의 과매수 및 과매도 현상을 발견하여 반전 지점에서 진입함으로써 좋은 투자 수익을 얻는 것을 목표로 합니다.
전략 원리
볼린저 밴드
볼린저 밴드는 중간선, 상단선, 하단선으로 구성됩니다. 중간선은 일반적으로 20일 이동평균선을 사용합니다. 상단선과 하단선은 각각 중간선 위와 아래의 두 표준편차 위치입니다. 가격이 하단선에 가까워지면 과매도 신호로 간주됩니다. 가격이 상단선에 가까워지면 과매수 신호로 간주됩니다.
RSI 지표
RSI 지표는 일정 기간 동안 종가 상승과 하락의 속도 변화를 반영하여 매수 세력과 매도 세력의 힘을 측정하는 데 사용됩니다. RSI 값이 0에서 30 사이일 때는 과매도 구간, 70에서 100 사이일 때는 과매수 구간입니다. RSI가 과매수 구간에서 하락하면 매도 신호로 사용될 수 있고, RSI가 과매도 구간에서 상승하면 매수 신호로 사용될 수 있습니다.
CCI 지표
CCI 지표는 주가가 평균 가격에서 얼마나 벗어나 있는지를 측정하는 데 사용됩니다. 여기서 +100은 가격이 평균보다 훨씬 높은 과매수 상태를, -100은 가격이 평균보다 훨씬 낮은 과매도 상태를 나타냅니다. CCI는 가격의 극단적인 상황을 반영할 수 있습니다.
전략 교차 신호
본 전략은 볼린저 밴드로 가격이 단기적으로 과매수 또는 과매도인지 판단하고, RSI 지표로 매수·매도 세력 균형 상태를 판단하며, CCI 지표로 가격 이탈 정도를 판단합니다. 볼린저 밴드, RSI 및 CCI 지표가 동시에 매수/매도 신호를 제공할 때 거래 명령이 발생합니다.
전략 장점
- 여러 지표를 결합하여 판단함으로써 잘못된 신호를 줄이고 신호 정확도를 높입니다.
- 시장의 전환점을 발견하여 반전 추세를 포착할 기회를 제공합니다.
- 각 매개변수를 사용자 정의하여 다양한 시장 환경에 적응할 수 있습니다.
- 이동평균선으로 CCI 지표를 필터링하여 노이즈를 줄이고 안정성을 높입니다.
위험 및 해결 방안
- 볼린저 밴드, RSI 및 CCI 지표 모두 잘못된 신호를 생성하여 거래 손실을 초래할 수 있습니다. 매개변수를 적절히 완화하거나 다른 지표를 추가하여 검증할 수 있습니다.
- CCI 지표는 변동성이 큰 시장에는 적합하지 않을 수 있으며, 이동평균선 또는 변동성 지표로 대체할 수 있습니다.
- 거래 명령에는 손절매만 있고 이익 실현은 없습니다. 이동식 이익 실현을 추가하여 일부 이익을 확보할 수 있습니다.
최적화 방향
- 더 다양한 매개변수 조합을 테스트하여 최적의 매개변수를 찾습니다.
- 머신러닝 알고리즘을 추가하여 실시간으로 매개변수를 최적화합니다.
- 이익 실현 전략을 추가하여 목표 수익을 설정합니다.
- MACD, KD 등 더 많은 지표를 결합하여 신호 신뢰성을 판단합니다.
요약
본 전략은 단기, 중기 및 장기 시장 상황을 종합적으로 고려하여 볼린저 밴드, RSI 및 CCI 세 가지 지표의 교차 신호를 통해 시장 반전 시점을 판단하는 비교적 안정적인 반전 추적 전략입니다. 매개변수 조정, 이익 실현 방식 등을 통해 추가 최적화가 가능하며 다양한 시장 환경에 적용할 수 있습니다.
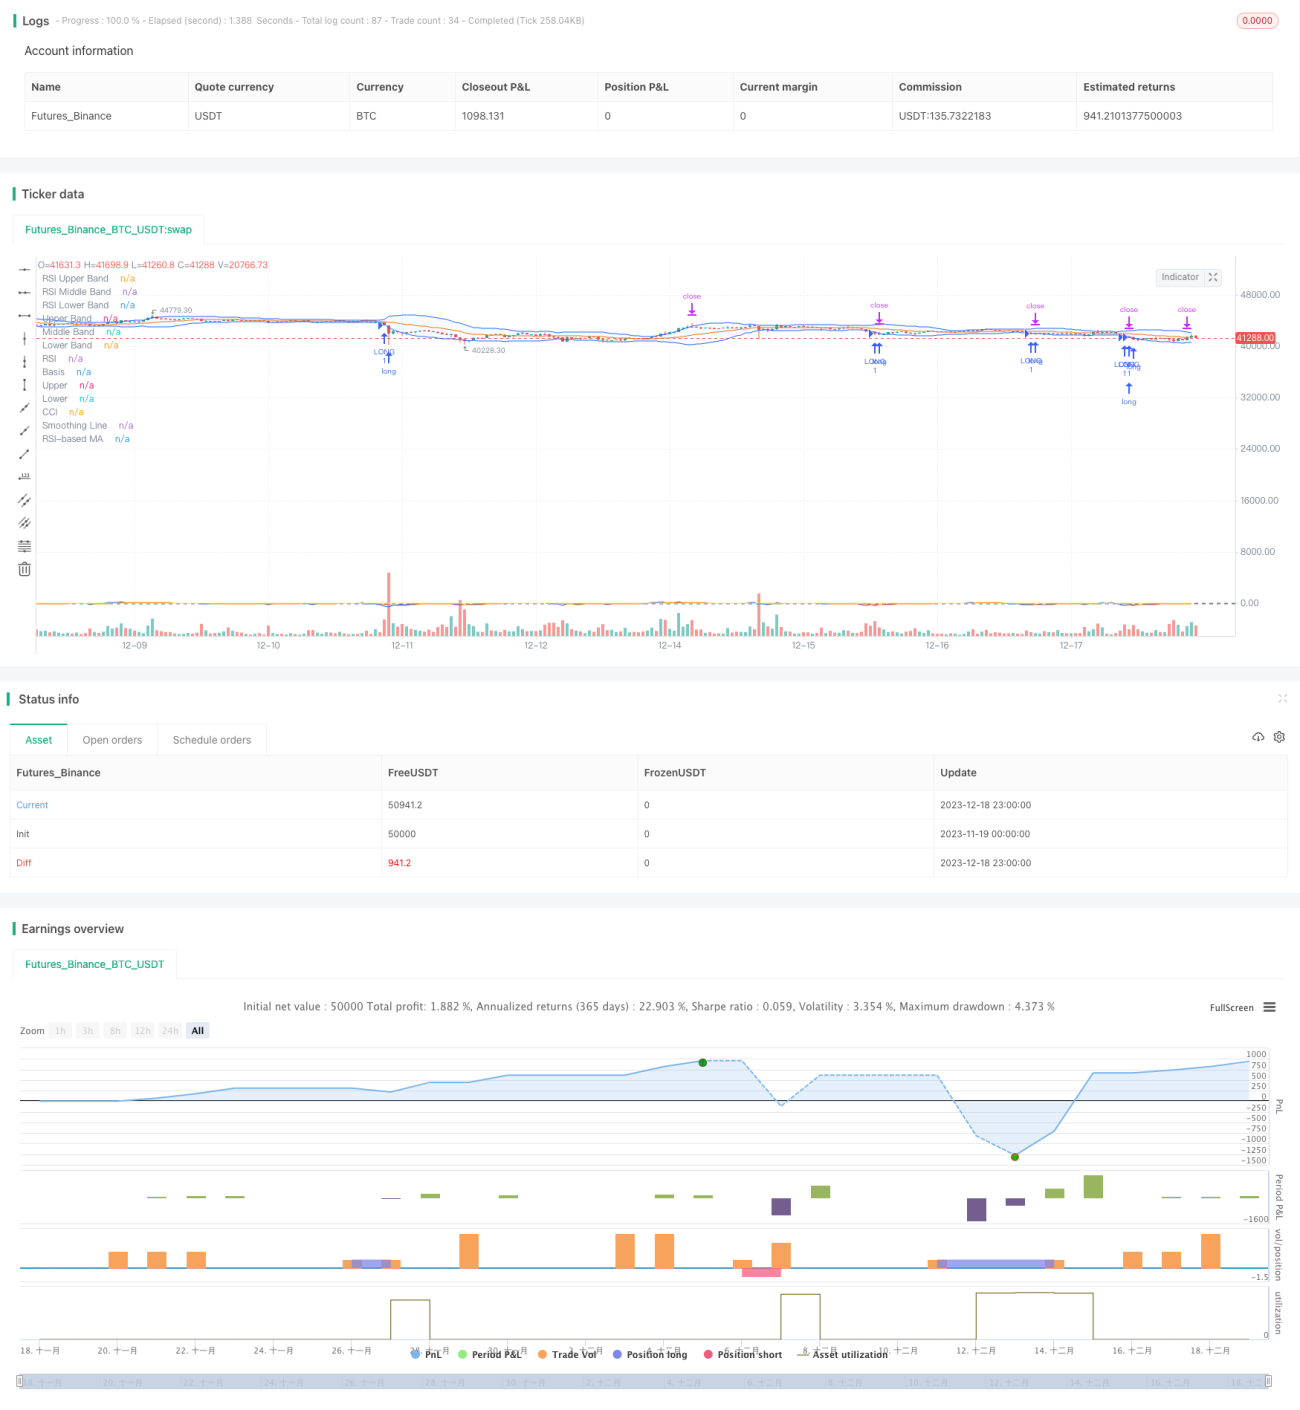
/*backtest
start: 2023-11-19 00:00:00
end: 2023-12-19 00:00:00
period: 1h
basePeriod: 15m
exchanges: [{"eid":"Futures_Binance","currency":"BTC_USDT"}]
*/

//@version=5
strategy(shorttitle="BBRSIstr", title="Bollinger Bands", overlay=true)
length = input.int(20, minval=1)
maType = input.string("SMA", "Basis MA Type", options = ["SMA", "EMA", "SMMA (RMA)", "WMA", "VWMA"])- 1