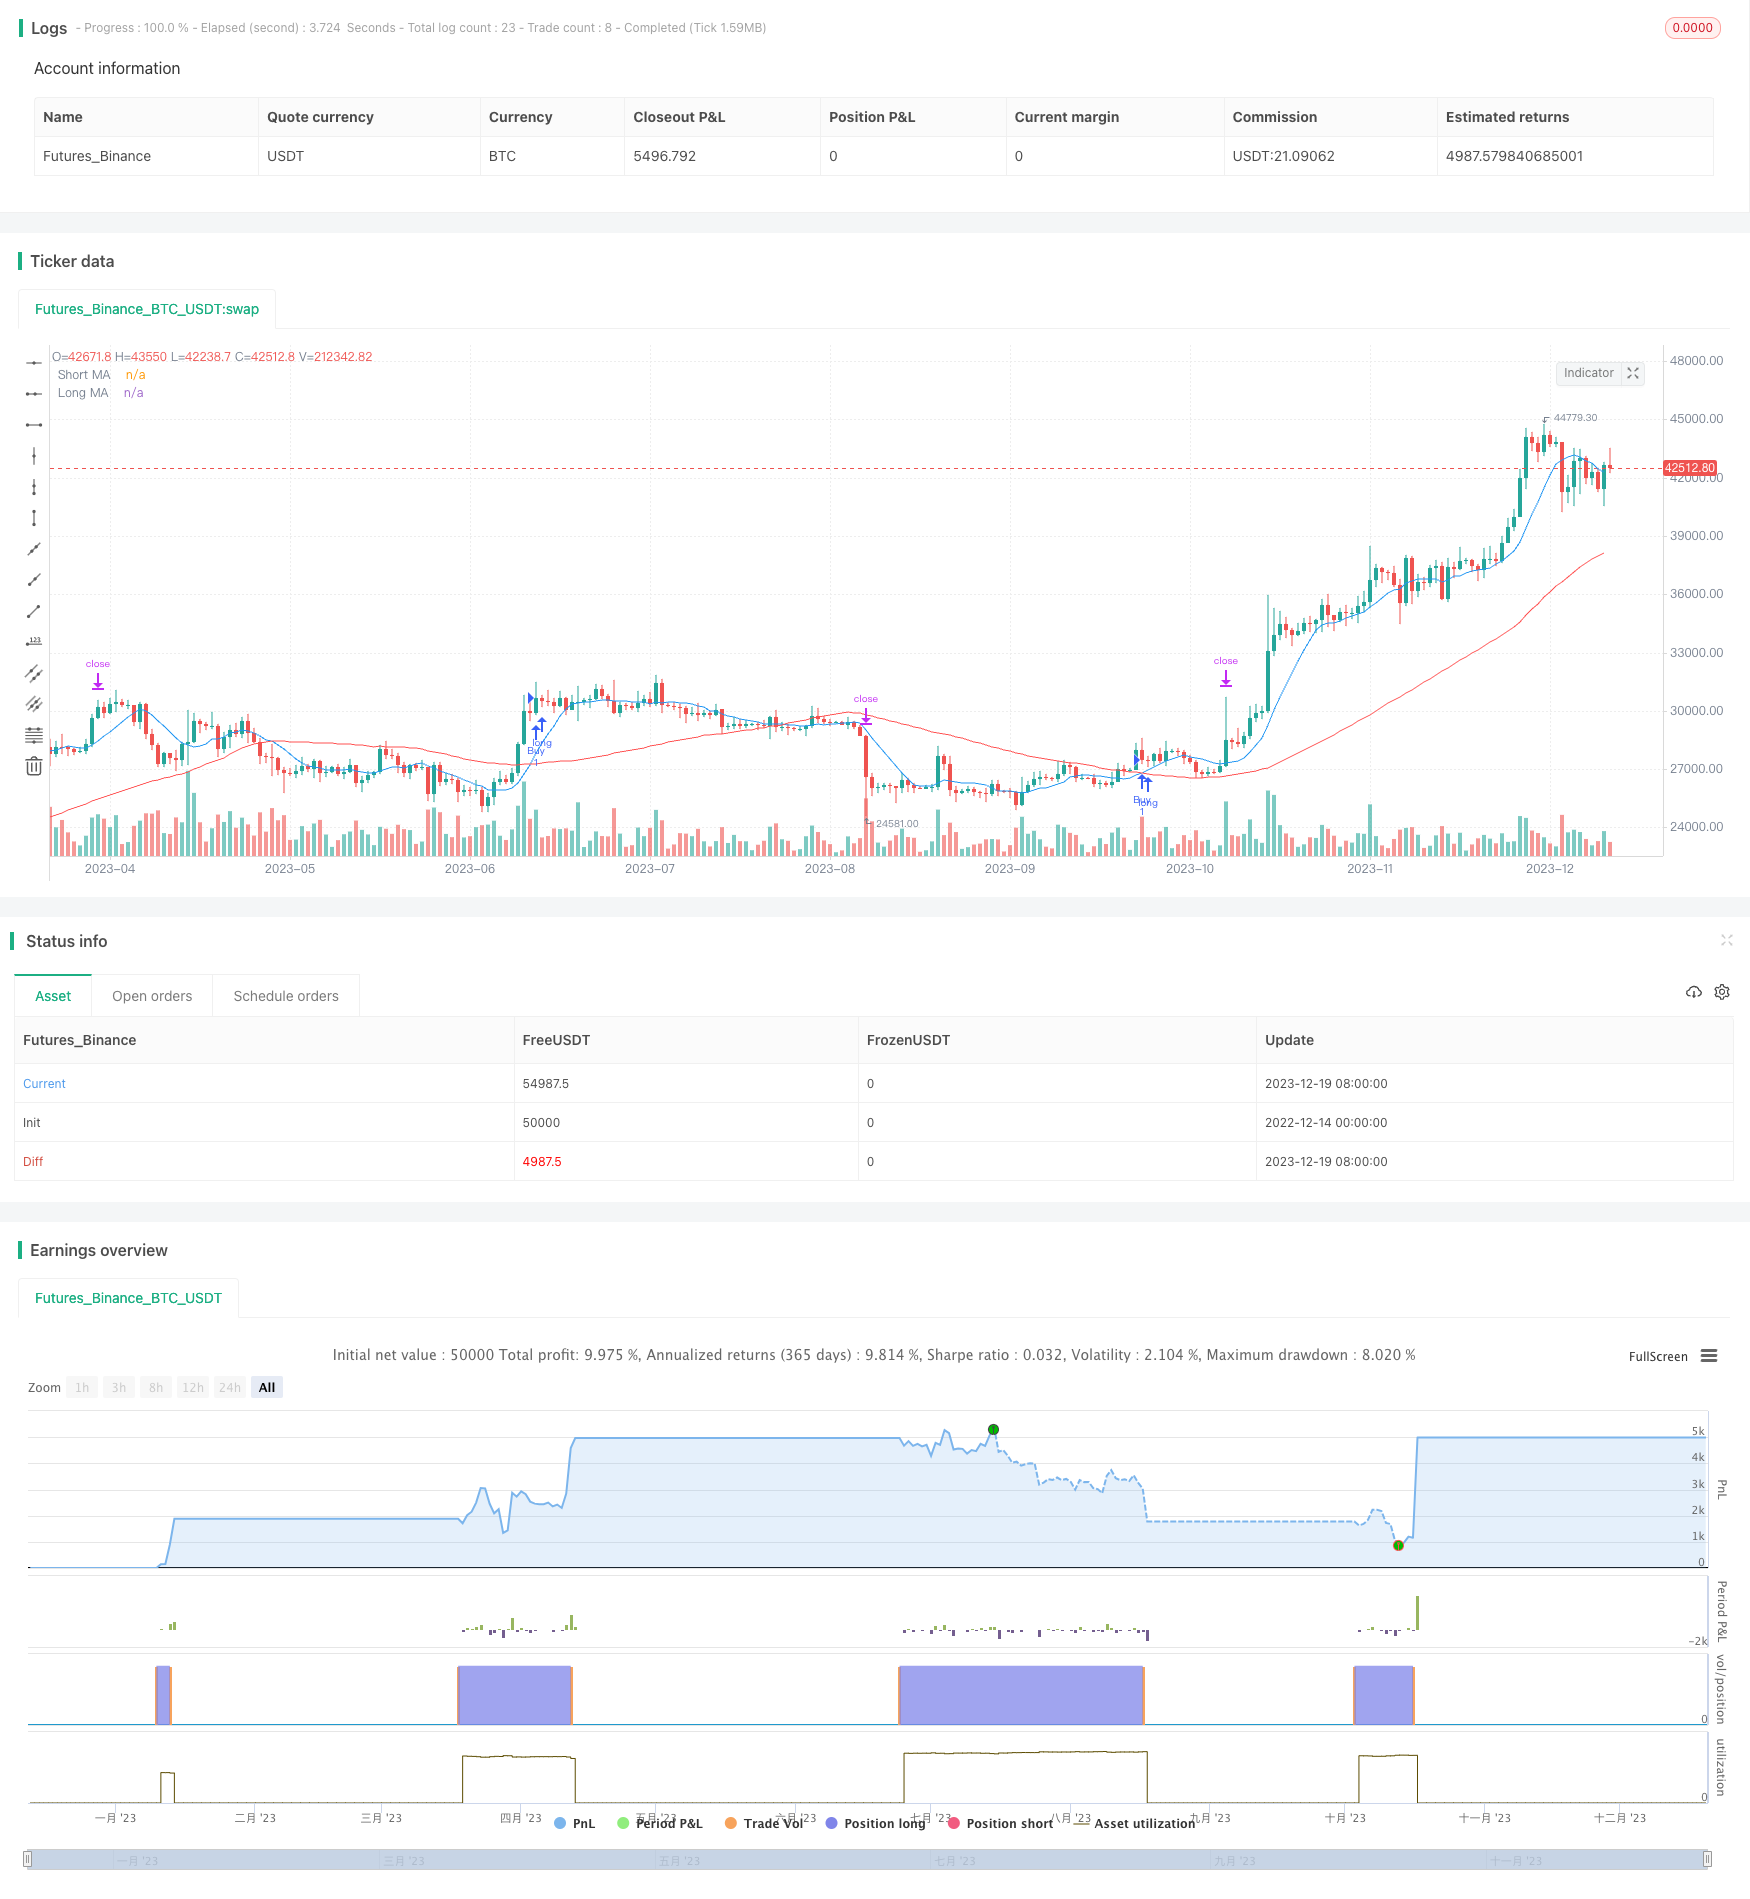
개요
이 전략은 다양한 주기의 이동 평균을 계산하여, 스톱 로드 스톱 포인트를 설정하여, 자동 거래를 구현한다. 짧은 주기 이동 평균 위에 긴 주기 이동 평균을 가로질러 할 때 더; 짧은 주기 이동 평균 아래에 긴 주기 이동 평균을 가로질러 할 때 공백한다. 동시에 스톱 로드 스톱 포인트를 설정하여 위험을 제어한다.
전략 원칙
이 전략은 평행선 교차 원리에 기초한다. 그것은 동시에 9일 간단한 이동 평균과 55일 간단한 이동 평균을 계산한다. 9일 평균선 위에 55일 평균선을 통과할 때, 단기 트렌드가 상향으로 반전되는 것을 의미하며, 이 때 더 많이 한다. 9일 평균선이 55일 평균선 아래에 통과할 때, 단기 트렌드가 하향으로 반전되는 것을 의미하며, 이 때 공백한다.
동시에, 이 전략은 ATR 지표를 사용하여 스톱로스 및 스톱포트를 설정한다. ATR 지표는 시장의 변동성을 측정한다. 스톱포트는 마감 가격 미만 ATR 값을 설정하여 시장의 변동성에 따라 합리적인 스톱포트를 설정할 수 있다.
전략적 이점
이것은 매우 간단하고 실용적인 단선 거래 전략으로 다음과 같은 장점이 있습니다.
- “평선교차는 간단하고 쉽게 이해할 수 있습니다.
- 동시에, 손해 차단과 차단이 결합되어, 위험을 효과적으로 통제하고, 실용성을 강화합니다.
- 이동 평균의 파라미터는 다양한 시장 환경에 따라 유연하게 조정할 수 있습니다.
- ATR 스톱은 시장의 변동성에 따라 스톱을 설정할 수 있으며, 비교적 지능적입니다.
- 리스크/보너스 비율은 개인의 리스크 선호도에 따라 조정할 수 있다.
전략적 위험
이 전략에는 몇 가지 위험도 있습니다.
- 일률적 교차 신호는 잘못된 거래로 이어질 수 있습니다.
- 부적절한 정지 또는 정지 설정은 손실을 증가시키거나 수익을 감소시킬 수 있습니다.
- 이동 평균 변수 설정이 잘못되면 거래 빈도가 너무 높거나 신호가 지연됩니다.
- ATR 파라미터를 잘못 설정하면 스톱포트가 너무 가깝거나 너무 멀어질 수 있습니다.
이러한 위험은 최적화 변수, 엄격한 중지, 합리적인 위치 관리로 감소시킬 수 있습니다.
전략 최적화
이 전략은 더욱 개선될 수 있습니다.
- 최적화 도구를 사용하여 최적의 이동 평균 변수 조합을 찾습니다.
- 다른 지표들을 필터링하여 균일선 교차 신호를 추가하여 가짜 돌파를 방지합니다.
- 다른 종류의 이동 평균을 시도해보세요. 지수 이동 평균 같은 것 말이죠.
- ATR 변수도 최적화하여 스톱더스를 더 똑똑하게 만들 수 있습니다.
요약하다
이 전략의 전체적인 아이디어는 명확하고 구현하기 쉬운데, 특히 초보자들에 적합하다. 기초적인 단선 거래 전략으로서, 동작이 단순하고 최적화하기 쉬운 등의 장점이 있다. COMPLETE 또는 다른 프레임워크와 함께 사용한다면, 이 전략을 더욱 강화하여 충분히 실용적인 수량화 거래 시스템으로 만들 수 있다.
/*backtest
start: 2022-12-14 00:00:00
end: 2023-12-20 00:00:00
period: 1d
basePeriod: 1h
exchanges: [{"eid":"Futures_Binance","currency":"BTC_USDT"}]
*/

//@version=5
strategy("MA Crossover Strategy with Stop-Loss and Take-Profit", overlay=true)

// Input for selecting the length of the moving averages
maShortLength = input(9, title="Short MA Length")
maLongLength = input(55, title="Long MA Length")

// Input for setting the risk-reward ratio
riskRewardRatio = input(2, title="Risk-Reward Ratio")

// Calculate moving averages
maShort = ta.sma(close, maShortLength)
maLong = ta.sma(close, maLongLength)

// Buy condition: 9-period MA crosses above 55-period MA
buyCondition = ta.crossover(maShort, maLong)

// Sell condition: 9-period MA crosses below 55-period MA
sellCondition = ta.crossunder(maShort, maLong)

// Set stop-loss and take-profit levels
atrValue = ta.atr(14)
stopLossLevel = close - atrValue  // Use ATR for stop-loss (adjust as needed)
takeProfitLevel = close + riskRewardRatio * atrValue  // Risk-reward ratio of 1:2

// Execute buy and sell orders with stop-loss and take-profit
strategy.entry("Buy", strategy.long, when = buyCondition)
strategy.exit("Sell", from_entry="Buy", loss=stopLossLevel, profit=takeProfitLevel)

// Plot moving averages on the chart
plot(maShort, color=color.blue, title="Short MA")
plot(maLong, color=color.red, title="Long MA")