개요
삼평선 교차동량 전략은 시장의 추세를 추적하는 전형적인 기술 지표 전략이다. 그것은 16주기, 36주기, 72주기의 세 개의 간단한 이동 평균을 결합하여, 그들의 다목적 교차와 빈목적 교차를 통해 시장의 추세를 판단하고, 카우프만 자기 적응 이동 평균을 결합하여, 추세 방향이 비교적 명확할 때, 더 많은 일을 하거나, 빈 일을 하는 필터로 사용한다.
전략 원칙
이 전략의 핵심 지표는 16주기, 36주기 및 72주기 세 개의 간단한 이동 평균이다. 짧은 주기 평균 선에 긴 주기 평균 선을 통과하면 시장이 다단계 트렌드에 들어간다는 것을 나타냅니다. 짧은 주기 평균 선 아래에 긴 주기 평균 선을 통과하면 시장이 공백 트렌드에 들어간다는 것을 나타냅니다. 예를 들어, 16주기 평균 선에 36주기 평균 선과 72주기 평균 선을 통과하면 다단계 신호이며, 16주기 평균 선 아래 36주기 평균 선과 72주기 평균 선을 통과하면 공백 신호입니다.
카우프만 자기 적응 이동 평균 ((KAMA) 는 추세가 불분명할 때 잘못된 신호를 방지하기 위해 필터로 사용됩니다. KAMA가 가속되지 않거나 느려지지 않는 모드 (즉, 선형 단락) 에서만 평선 교차 신호가 활성화됩니다.
전략은 평균선의 교차 상황을 추적하여, 추세가 더 밝을 때, 더하거나 공백을 취하는 작업을 수행한다. 더하는 조건은 16 평균선에서 36 평균선과 72 평균선을 통과하고, KAMA 선형 ((고속화되지 않은); 공백 조건은 16 평균선 아래에 36 평균선과 72 평균선을 통과하고, KAMA 선형 ((고속화되지 않은)) 이다.
우위 분석
이 전략은 다음과 같은 장점을 가지고 있습니다.
- 여러 시간대 평균선과 결합하여 중장선 추세를 효과적으로 추적할 수 있습니다.
- 적응형 이동 평균을 필터로 도입하여 추세가 불확실할 때 잘못된 신호를 줄일 수 있습니다.
- 작동이 간단하고 실행이 쉬우며 자동 또는 프로그램 거래에 적합하다.
위험 분석
이 전략에는 몇 가지 위험도 있습니다.
- 진동상태에서 평선교차가 빈번하게 발생할 수 있으며, 너무 많은 무효 신호를 생성할 수 있다.
- 단축이 설정되지 않으면 손실이 커질 수 있습니다.
- 암호화폐와 같은 높은 변동성을 가진 시장에 대한 설계는 낮은 변동성을 가진 시장에 좋지 않을 수 있습니다.
적당히 조정된 평균선 변수, 스톱로스 제약, 또는 변동성이 높은 시장에서만 이 전략을 사용함으로써 위험을 줄일 수 있다.
최적화 방향
이 전략은 다음과 같은 방법으로 최적화될 수 있습니다.
- 다양한 평균선 변수 조합을 테스트하여 최적의 변수를 찾습니다.
- 보조 필터링 조건으로 거래량 또는 변동률 지표를 증가시키는 것
- 손해 방지 장치 설정
- 다른 지표와 함께 경기 출전 시점을 판단하는 방법
- 포지션 관리를 최적화하고, 포지션을 점진적으로 증가시키고 감소시켜 위험을 조정합니다.
요약하다
삼평선 교차동력 전략은 전체적으로 좀 더 고전적이고 실용적인 트렌드 트렌드 전략이다. 이는 여러 시간 동안의 평균선의 교차를 통해 시장의 중장선 움직임을 판단하고, 일부 소음을 효과적으로 필터링한다. 선택적 거래의 참조 지표 중 하나로 사용할 수 있다. 그러나 이 전략은 또한 특정 약점이 있으며, 더 넓은 시장에서 중립성을 확보하기 위해 추가 확장 및 최적화가 필요합니다.
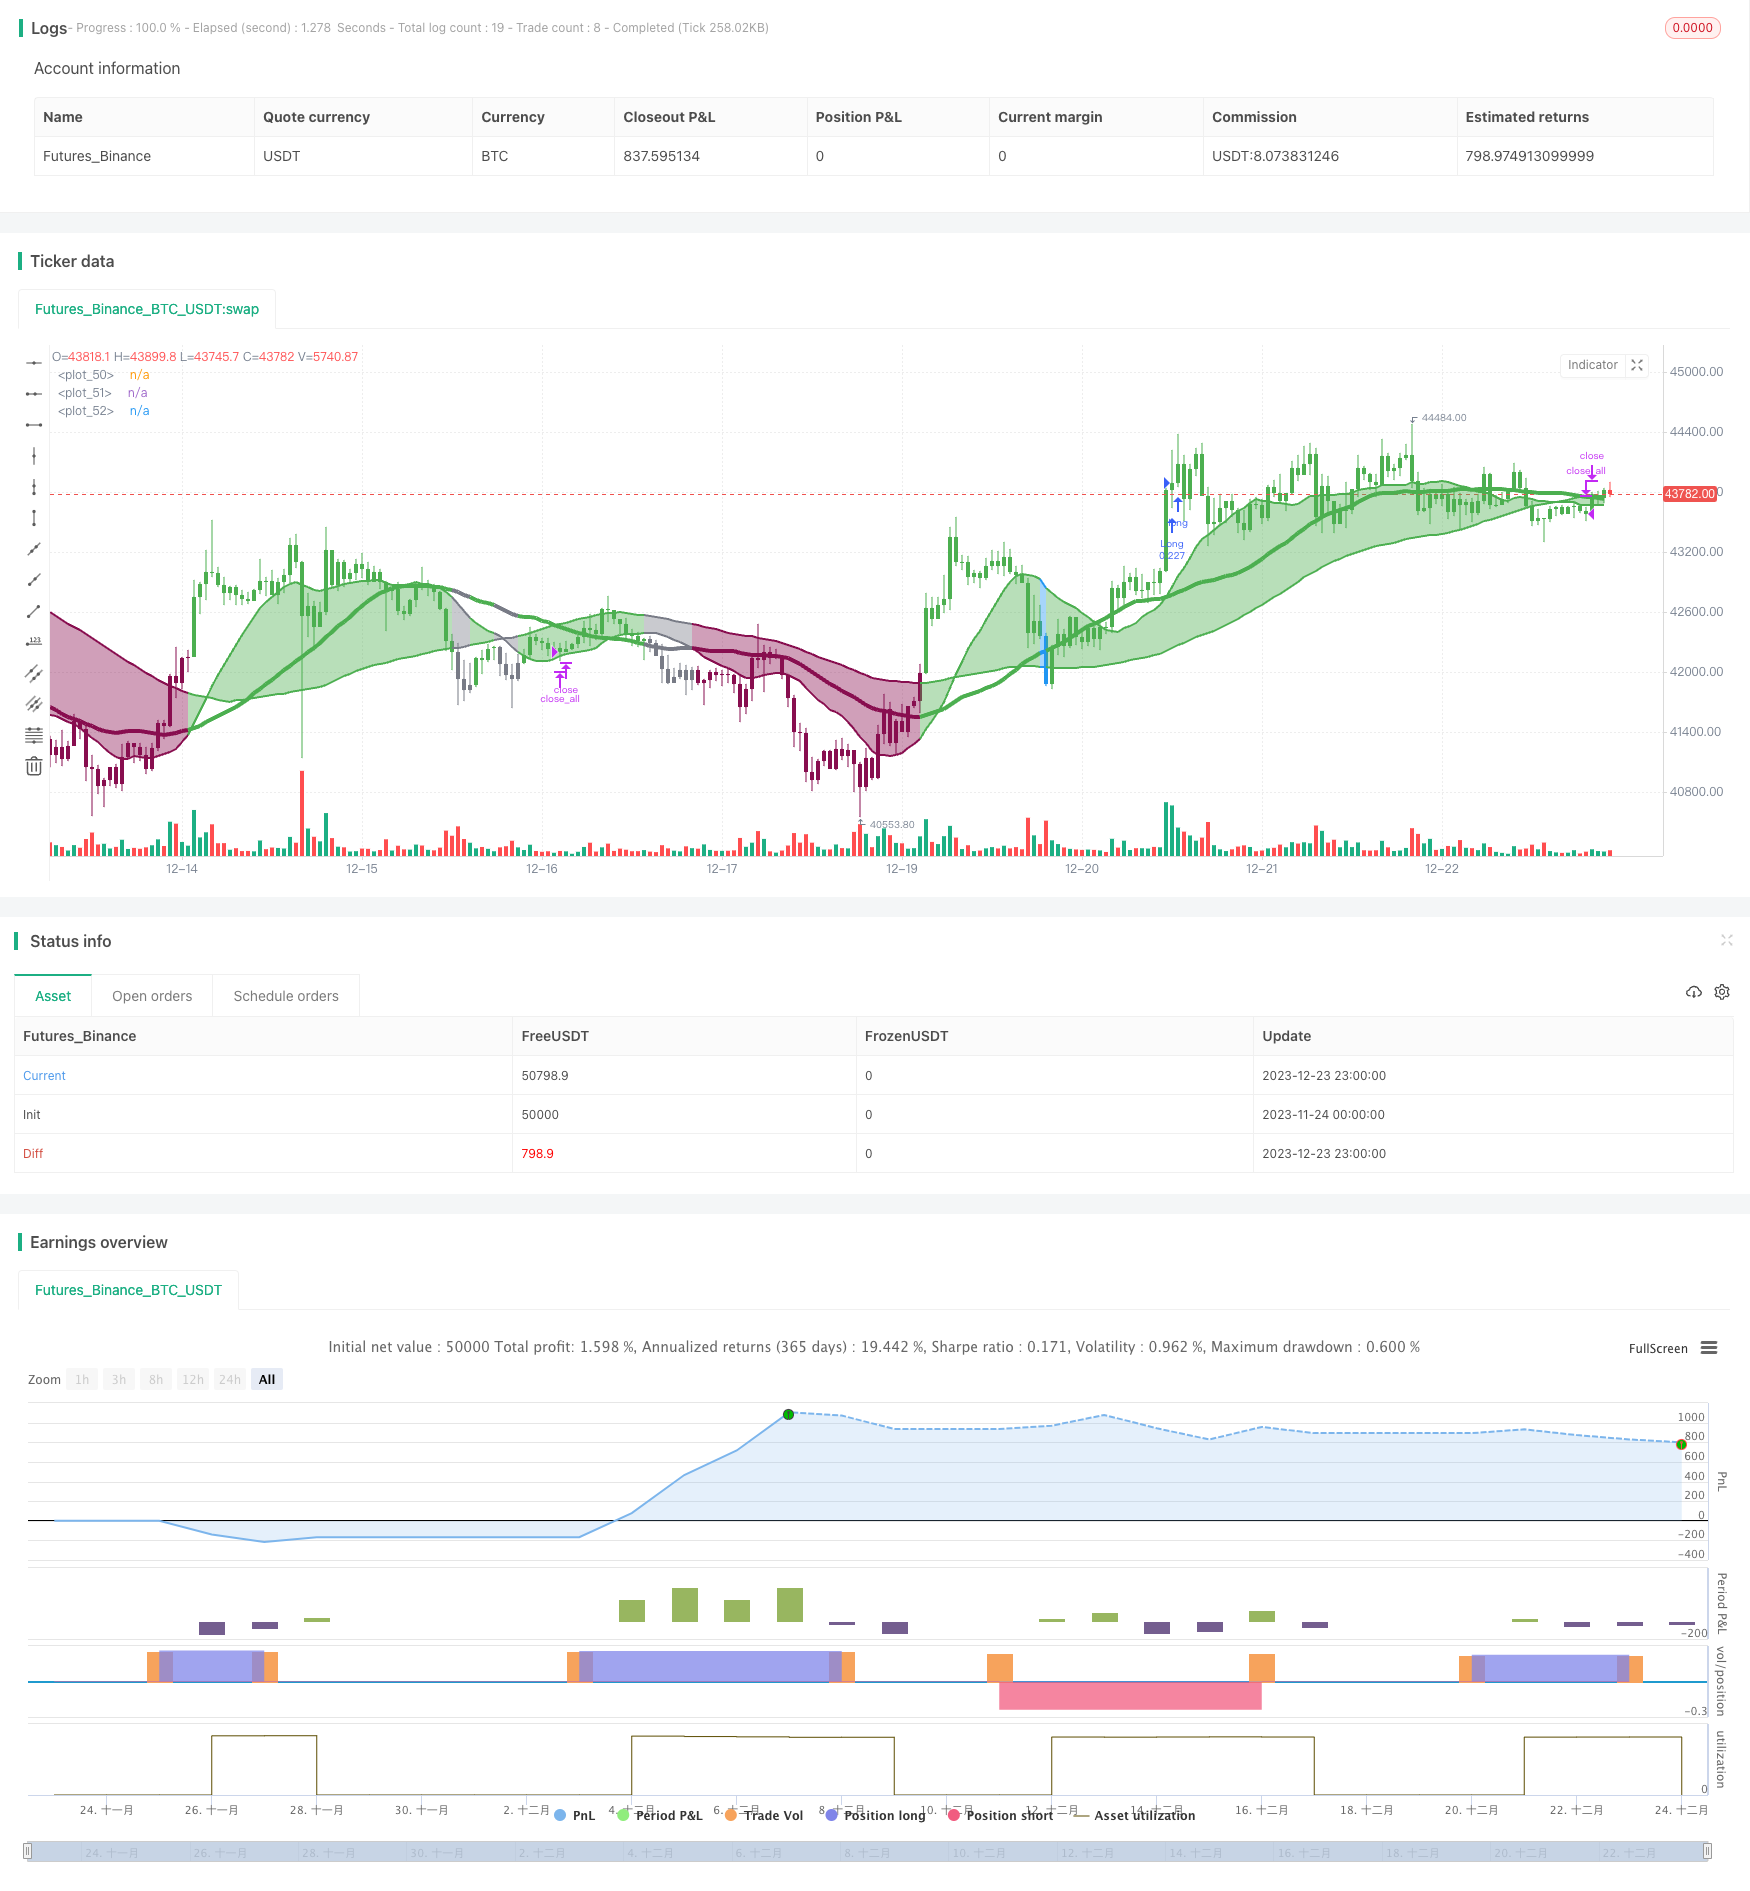
/*backtest
start: 2023-11-24 00:00:00
end: 2023-12-24 00:00:00
period: 1h
basePeriod: 15m
exchanges: [{"eid":"Futures_Binance","currency":"BTC_USDT"}]
*/

// This source code is subject to the terms of the Mozilla Public License 2.0 at https://mozilla.org/MPL/2.0/
// © Wielkieef


//@version=5
strategy(title='Three SMA-crossover strategy [30min] ', overlay=true, pyramiding=1, initial_capital=10000, default_qty_type=strategy.cash, default_qty_value=10000, calc_on_order_fills=false, slippage=0, commission_type=strategy.commission.percent, commission_value=0.03)

src = close

Length1 = input.int(16, title='  1-SMA Lenght', minval=1, group='SMA')
Length2 = input.int(36, title='  2-SMA Lenght', minval=1, group='SMA')
Length3 = input.int(72, title='  3-SMA Lenght', minval=1, group='SMA')
SMA1 = ta.sma(close, Length1)
SMA2 = ta.sma(close, Length2)
SMA3 = ta.sma(close, Length3)

Long_ma = SMA1 > SMA2 and SMA2 > SMA3
Short_ma = SMA1 < SMA2 and SMA2 < SMA3

LengthMainSMA = input.int(100, title='  Trend SMA ', minval=1)

SMAas = ta.sma(src, LengthMainSMA)

//  Powered Kaufman Adaptive Moving Average by alexgrover (modificated by Wielkieef)
lengthas = input.int(50, title='   KAMA Lenght')
sp = input.bool(true, title='  Self Powered')

er = math.abs(ta.change(close, lengthas)) / math.sum(math.abs(ta.change(close)), lengthas)
pow = sp ? 1 / er : 2
per = math.pow(math.abs(ta.change(close, lengthas)) / math.sum(math.abs(ta.change(close)), lengthas), pow)
a = 0.
a := per * src + (1 - per) * nz(a[1], src)
mad4h = 0.
a_f = a / a[1] > .999 and a / a[1] < 1.001

///.

Bar_color = close > SMAas ? color.green : Long_ma ? color.blue : Short_ma ? color.maroon : color.gray

barcolor(color=Bar_color)

long_cond = Long_ma and SMAas < close and not a_f and close > a

short_cond = Short_ma and SMAas > close and not a_f and close < a

long_stop = Short_ma and SMAas < close

short_stop = Long_ma and SMAas > close

SMA1plot = plot(SMA1, color=Bar_color, linewidth=2)
SMA2plot = plot(SMA2, color=Bar_color, linewidth=4)
SMA3plot = plot(SMA3, color=Bar_color, linewidth=2)

fill(SMA1plot,SMA3plot,title="RANGE " ,color = color.new(Bar_color, 50))


if  long_cond
    strategy.entry('Long', strategy.long)

if  short_cond
    strategy.entry('Short', strategy.short)

strategy.close_all(when=long_stop or short_stop)


//by wielkieef