개요
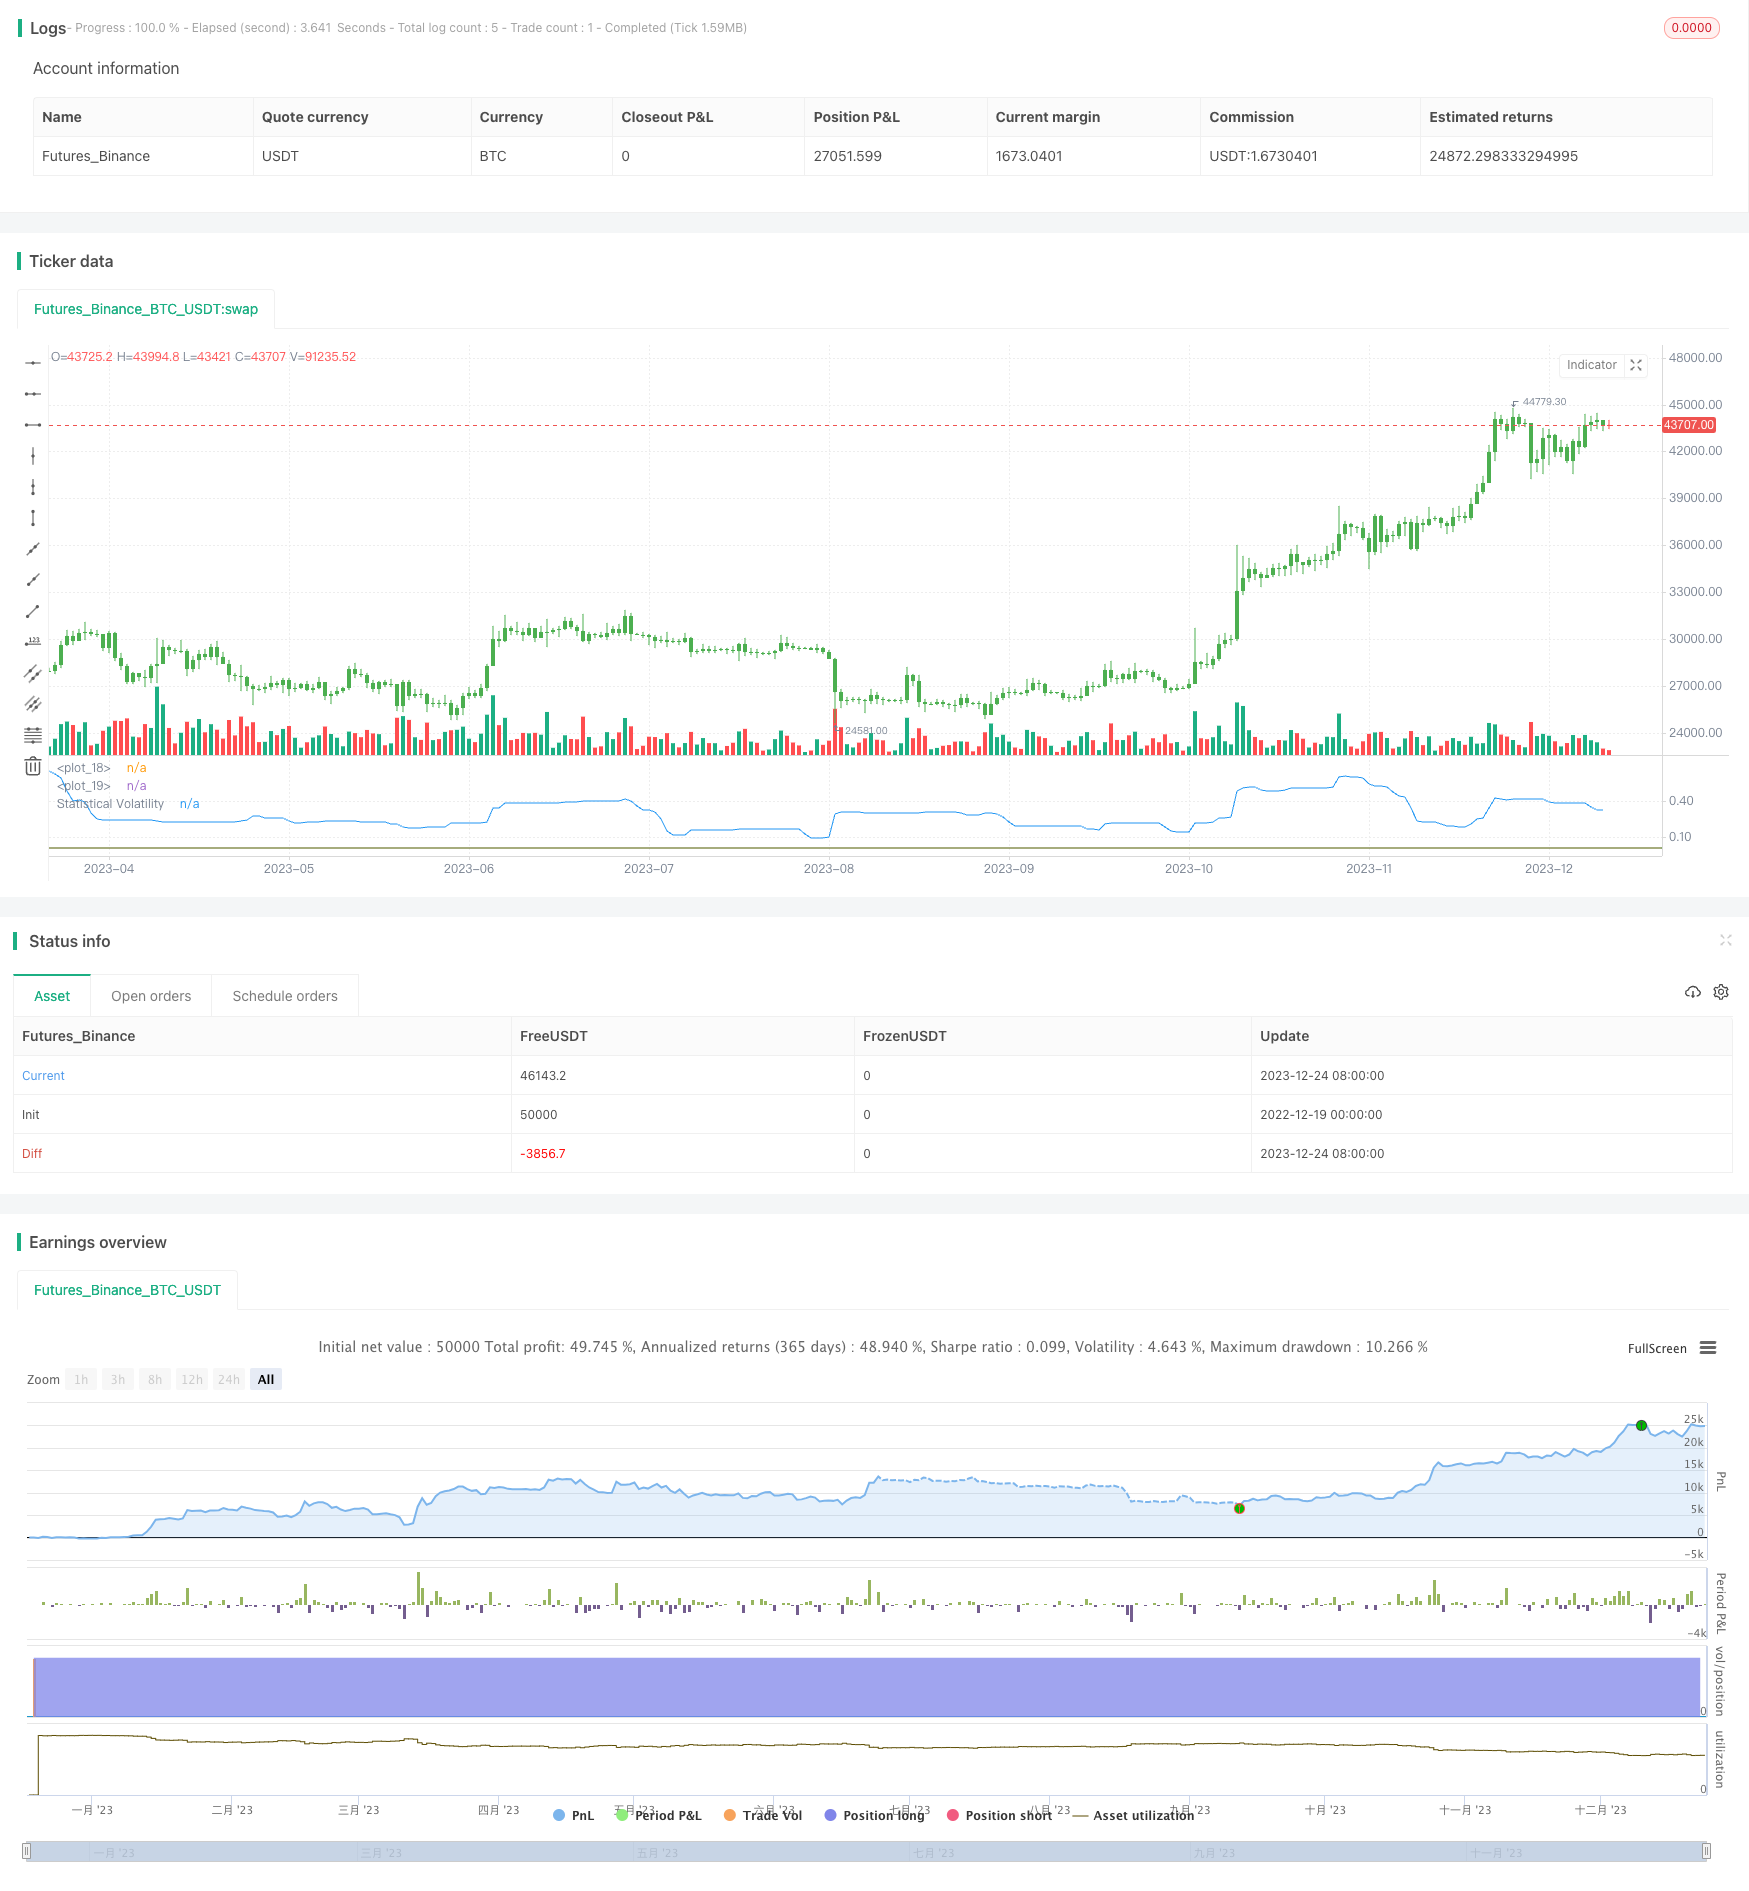
이 전략은 극한값법으로 통계적 변동률을 계산합니다. 이것은 최고 가격, 최저 가격, 종결 가격의 극한값과 시간적 요소를 결합하여 통계적 변동률을 계산합니다. 이 변동률은 자산 가격의 변동성을 반영합니다. 전략은 변동률이 설정된 하위값보다 높거나 낮을 때, 그에 따른 다중 또는 공백 거래를합니다.
전략 원칙
일정 시간 동안의 최고 가격, 최저 가격, 종결 가격의 극치를 계산합니다.
극대값법 공식을 적용하여 통계적 변동률을 계산한다
SqrTime = sqrt(253 / Length)
Vol = ((0.6 * log(xMaxC / xMinC) * SqrTime) + (0.6 * log(xMaxH / xMinL) * SqrTime)) * 0.5
변동률과 설정된 상하한값을 비교하여 거래 신호를 생성합니다.
pos = iff(nRes > TopBand, 1,
         iff(nRes < LowBand, -1, nz(pos[1], 0)))
트레이딩 신호에 따라 더 많이 또는 더 적게 할 수 있습니다.
우위 분석
이 전략의 주요 장점은 다음과 같습니다.
- 통계적 변동성 지표를 사용하여 시장의 열기와 역전 기회를 효과적으로 포착할 수 있습니다.
- 극한값법으로 변동률을 계산하고, 극한 가격에 민감하지 않으며, 결과가 더 안정적이고 신뢰할 수 있다.
- 변수를 조정하여 다양한 변동률 환경에 맞게 거래할 수 있습니다.
위험 분석
이 전략에는 다음과 같은 위험들이 있습니다.
- 통계적 변동률 자체는 다소 뒤처져 있고 시장의 전환점을 정확하게 파악할 수 없습니다.
- 변동률 지표는 갑작스러운 사건에 느리게 반응하여 단기 거래 기회를 놓칠 수 있습니다.
- 특정 거래의 위험과 손실의 위험
대책과 해결책:
- 통계주기를 적절히 단축하고 시장 변화에 대한 민감성을 높여라
- 신호의 정확성을 높이기 위해 다른 지표와 함께 보조
- 단위 손실을 제어하기 위해 스톱포트를 설정합니다.
최적화 방향
이 전략의 최적화 방향은:
- 다양한 통계주기 변수를 테스트하여 최적의 변수를 찾아내는 방법
- 포지션 관리 모듈을 추가하여 변동률에 따라 포지션을 조정합니다.
- 이동 평균과 같은 지표와 결합하여 필터링 조건을 설정하여 잘못된 거래를 줄이십시오.
요약하다
이 전략은 극대수법으로 통계적 변동률을 계산하여 변동률 이진성을 포착하여 거래 신호를 생성한다. 단순한 이동 평균과 같은 지표에 비해 시장의 변동성을 더 잘 반영하고 역전을 포착한다. 동시에, 극대수법 알고리즘은 결과를 더 안정적이고 신뢰할 수 있게 만든다. 매개 변수를 조정하고 최적화함으로써 이 전략은 다양한 시장 상황에 적응할 수 있으며, 거래 아이디어와 통계적 변동률 지표는 추가 연구와 응용에 가치가 있다.
전략 소스 코드
/*backtest
start: 2022-12-19 00:00:00
end: 2023-12-25 00:00:00
period: 1d
basePeriod: 1h
exchanges: [{"eid":"Futures_Binance","currency":"BTC_USDT"}]
*/

//@version=2
////////////////////////////////////////////////////////////
//  Copyright by HPotter v1.0 22/11/2014
// This indicator used to calculate the statistical volatility, sometime
// called historical volatility, based on the Extreme Value Method.
// Please use this link to get more information about Volatility.
//
// You can change long to short in the Input Settings
// WARNING:
// - For purpose educate only
// - This script to change bars colors.
////////////////////////////////////////////////////////////
strategy(title="Statistical Volatility - Extreme Value Method ", shorttitle="Statistical Volatility Backtest")
Length = input(30, minval=1)
TopBand = input(0.005, step=0.001)
LowBand = input(0.0016, step=0.001)
reverse = input(false, title="Trade reverse")
hline(TopBand, color=red, linestyle=line)
hline(LowBand, color=green, linestyle=line)
xMaxC = highest(close, Length)
xMaxH = highest(high, Length)
xMinC = lowest(close, Length)
xMinL = lowest(low, Length)
SqrTime = sqrt(253 / Length)
Vol = ((0.6 * log(xMaxC / xMinC) * SqrTime) + (0.6 * log(xMaxH / xMinL) * SqrTime)) * 0.5
nRes = iff(Vol < 0,  0, iff(Vol > 2.99, 2.99, Vol))
pos = iff(nRes > TopBand, 1,
	   iff(nRes < LowBand, -1, nz(pos[1], 0)))
possig = iff(reverse and pos == 1, -1,
          iff(reverse and pos == -1, 1, pos))
if (possig == 1)
    strategy.entry("Long", strategy.long)
if (possig == -1)
    strategy.entry("Short", strategy.short)
barcolor(possig == -1 ? red: possig == 1 ? green : blue )
plot(nRes, color=blue, title="Statistical Volatility")