개요
이중 트렌드 추적 전략은 동시적으로 이중 지표 판단 트렌드를 결합한 양적 거래 전략이다. 이 전략은 우선 123 역전 지표 판단 가격 역전 신호를 이용한 다음 방향 추세 지표 ((DTI) 판단 가격 추세 방향을 결합하여 쌍 확인 하계 신호를 실현한다.
전략 원칙
이 전략은 크게 두 가지로 구성됩니다.
- 123 역전 지표
123 역전 지표의 판단 원칙은 다음과 같습니다.
2일 연속으로 상향상승을 거듭하고 9일 연속으로 K선이 50보다 낮아지면 더 많이 한다.
2일 연속으로 하락하고 9일 K선 50이 넘으면 공백을 다.
이 사진들은 가격의 전환 시점을 파악하는 데 도움이 됩니다.
- 방향 경향 지표 ((DTI)
DTI 지표의 판단 원리는 다음과 같다: 일정 시간 동안의 가격 변동의 절대값 평균선을 계산한 다음 가격의 평균 파도량으로 나누었다.
DTI가 초과 구매선보다 높을 때, 이는 현재 하향 추세임을 나타냅니다.
DTI가 초과 판매선보다 낮을 때, 현재 상승 추세임을 나타냅니다.
- 둘 다 합쳐서
먼저 123 역전 지표를 사용하여 가격 반전 신호가 발생했는지 판단하고 DTI 지표와 결합하여 역전 후 가격의 전반적인 경향 방향을 판단합니다.
이것은 단순히 반전 신호에 의존하는 가짜 반전의 문제를 피할 수 있으며, 전략의 안정성과 수익성을 향상시킬 수 있다.
전략적 이점
이중 지표 확인, 가짜 반전 위험 방지
역전과 추세 판단을 결합하여 운영의 유연성과 안정성을 고려합니다.
파라미터를 최적화할 수 있는 넓은 공간, 다양한 품종에 적응할 수 있는 유연한 조정
위험 분석
DTI 파라미터를 설정하는 것은 경험이 필요하며, 트렌드 방향을 잘못 판단하는 것은 적절하지 않습니다.
반전으로 인해 새로운 트렌드가 형성되는 것은 아니며, RANGE 시티가 흔들릴 수도 있습니다.
단독 손실을 통제하기 위한 효율적인 손해배상
해결 방법: 변수 최적화 테스트 + 합리적인 중지 + 다른 지표와 결합
전략 최적화 방향
DTI 변수를 테스트하여 최적의 변수 조합을 찾습니다.
다른 지표와 함께 필터링 가짜 반전 신호
손해배상 전략을 최적화하고 최적의 손해배상 지점을 찾아내기
요약하다
이중 트렌드 추적 전략은 123 반전과 DTI 이중 지표 확인을 통해 가격 반전의 본질을 효과적으로 판단하고 새로운 트렌드 방향을 포착하여 전략의 수익률을 높일 수 있습니다. 그러나 변수 설정과 중단 손실 전략은 전략의 수익 공간을 극대화하기 위해 계속 테스트 및 최적화가 필요합니다.
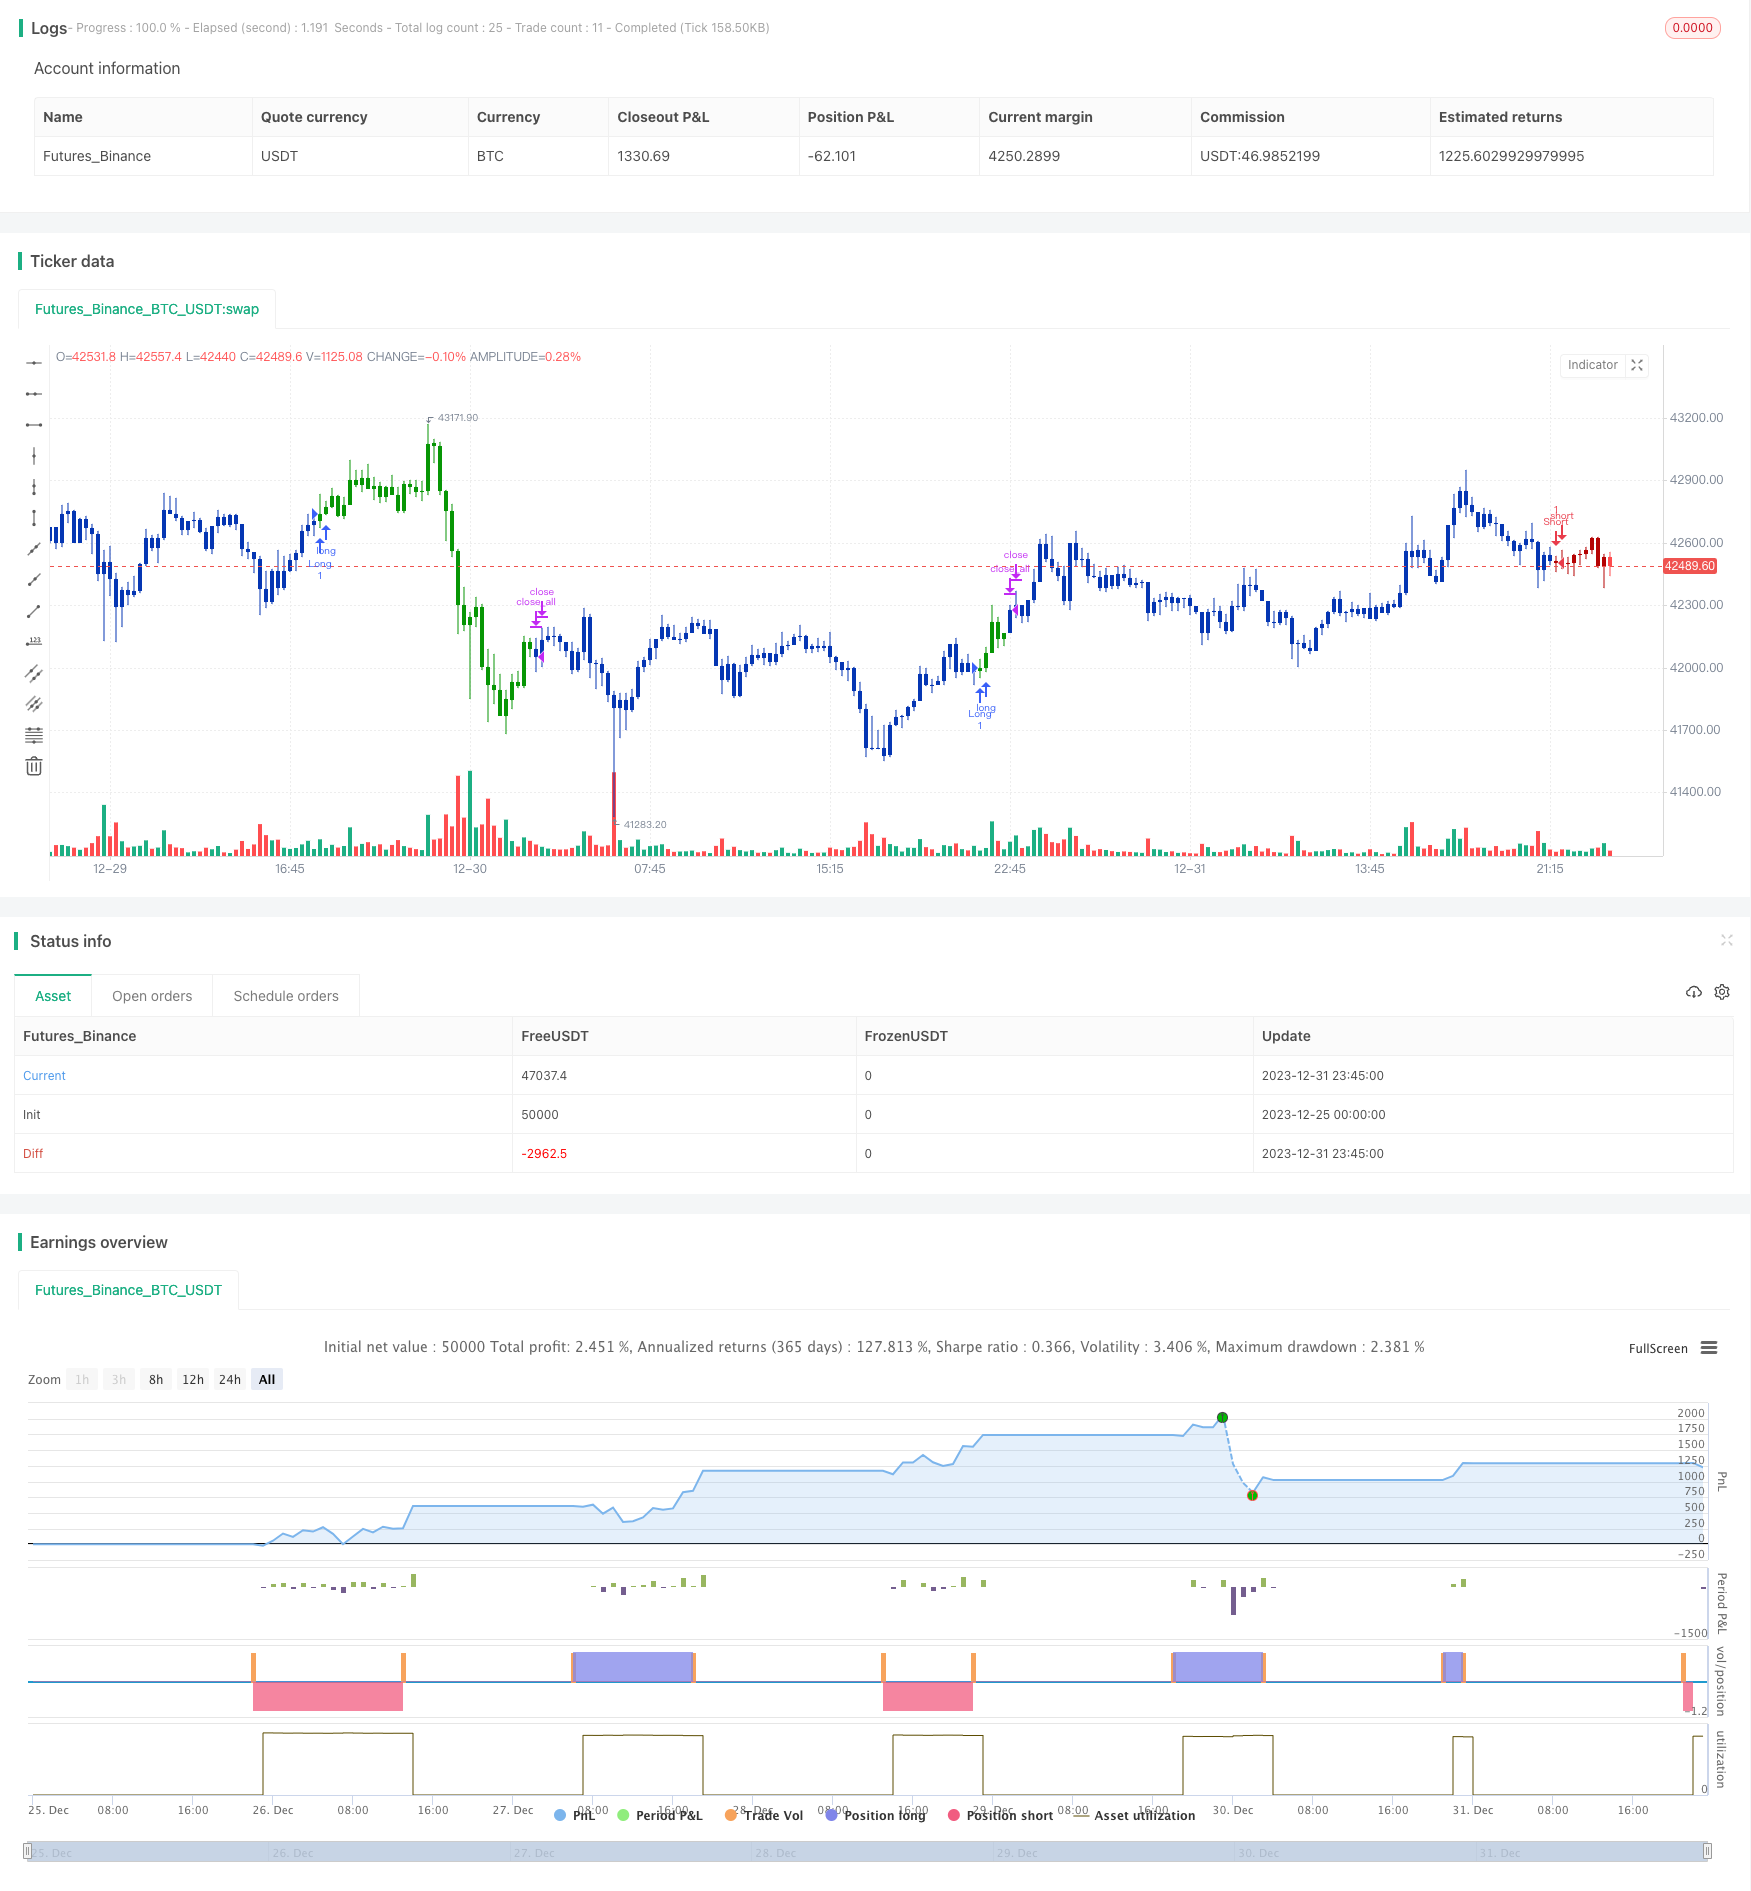
/*backtest
start: 2023-12-25 00:00:00
end: 2024-01-01 00:00:00
period: 15m
basePeriod: 5m
exchanges: [{"eid":"Futures_Binance","currency":"BTC_USDT"}]
*/

//@version=4
////////////////////////////////////////////////////////////
//  Copyright by HPotter v1.0 19/02/2020
// This is combo strategies for get a cumulative signal.
//
// First strategy
// This System was created from the Book "How I Tripled My Money In The
// Futures Market" by Ulf Jensen, Page 183. This is reverse type of strategies.
// The strategy buys at market, if close price is higher than the previous close
// during 2 days and the meaning of 9-days Stochastic Slow Oscillator is lower than 50.
// The strategy sells at market, if close price is lower than the previous close price
// during 2 days and the meaning of 9-days Stochastic Fast Oscillator is higher than 50.
//
// Second strategy
// This technique was described by William Blau in his book "Momentum,
// Direction and Divergence" (1995). His book focuses on three key aspects
// of trading: momentum, direction and divergence. Blau, who was an electrical
// engineer before becoming a trader, thoroughly examines the relationship between
// price and momentum in step-by-step examples. From this grounding, he then looks
// at the deficiencies in other oscillators and introduces some innovative techniques,
// including a fresh twist on Stochastics. On directional issues, he analyzes the
// intricacies of ADX and offers a unique approach to help define trending and
// non-trending periods.
// Directional Trend Index is an indicator similar to DM+ developed by Welles Wilder.
// The DM+ (a part of Directional Movement System which includes both DM+ and
// DM- indicators) indicator helps determine if a security is "trending." William
// Blau added to it a zeroline, relative to which the indicator is deemed positive or
// negative. A stable uptrend is a period when the DTI value is positive and rising, a
// downtrend when it is negative and falling.
//
// WARNING:
// - For purpose educate only
// - This script to change bars colors.
////////////////////////////////////////////////////////////
Reversal123(Length, KSmoothing, DLength, Level) =>
    vFast = sma(stoch(close, high, low, Length), KSmoothing)
    vSlow = sma(vFast, DLength)
    pos = 0.0
    pos := iff(close[2] < close[1] and close > close[1] and vFast < vSlow and vFast > Level, 1,
	         iff(close[2] > close[1] and close < close[1] and vFast > vSlow and vFast < Level, -1, nz(pos[1], 0)))
	pos

TDI(r,s,u,OS,OB) =>
    pos = 0.0
    xHMU = iff(high - high[1] > 0, high - high[1], 0)
    xLMD = iff(low - low[1] < 0, -(low - low[1]), 0)
    xPrice = xHMU - xLMD
    xPriceAbs = abs(xPrice)
    xuXA = ema(ema(ema(xPrice, r),s),u)
    xuXAAbs = ema(ema(ema(xPriceAbs, r),s),u)
    Val1 = 100 * xuXA
    Val2 = xuXAAbs
    DTI = iff(Val2 != 0, Val1 / Val2, 0)
    pos := iff(DTI > OS, -1,
    	     iff(DTI < OB, 1, nz(pos[1], 0)))
    pos

strategy(title="Combo Backtest 123 Reversal & Directional Trend Index (DTI)", shorttitle="Combo", overlay = true)
Length = input(14, minval=1)
KSmoothing = input(1, minval=1)
DLength = input(3, minval=1)
Level = input(50, minval=1)
//-------------------------
r = input(14, minval=1)
s = input(10, minval=1)
u = input(5, minval=1)
OS = input(45, minval=1)
OB = input(-45, maxval=-1)
reverse = input(false, title="Trade reverse")
posReversal123 = Reversal123(Length, KSmoothing, DLength, Level)
posTDI = TDI(r,s,u,OS,OB)
pos = iff(posReversal123 == 1 and posTDI == 1 , 1,
	   iff(posReversal123 == -1 and posTDI == -1, -1, 0))
possig = iff(reverse and pos == 1, -1,
          iff(reverse and pos == -1 , 1, pos))
if (possig == 1)
    strategy.entry("Long", strategy.long)
if (possig == -1)
    strategy.entry("Short", strategy.short)
if (possig == 0)
    strategy.close_all()
barcolor(possig == -1 ? #b50404: possig == 1 ? #079605 : #0536b3 )