개요
이 전략은 K 선의 ?? 의미 기둥 선의 을 판단하여 트렌드를 예측하고, 돌파 신호와 결합하여 거래 신호를 발산한다. 전략은 너무 작은 K 선을 필터링하여, ?? 의미 기둥 선의 에만 분석하여, 너무 자주 작은 하락으로 방해를 피할 수 있으며, 신호를 더 평평하고 신뢰할 수 있게 한다.
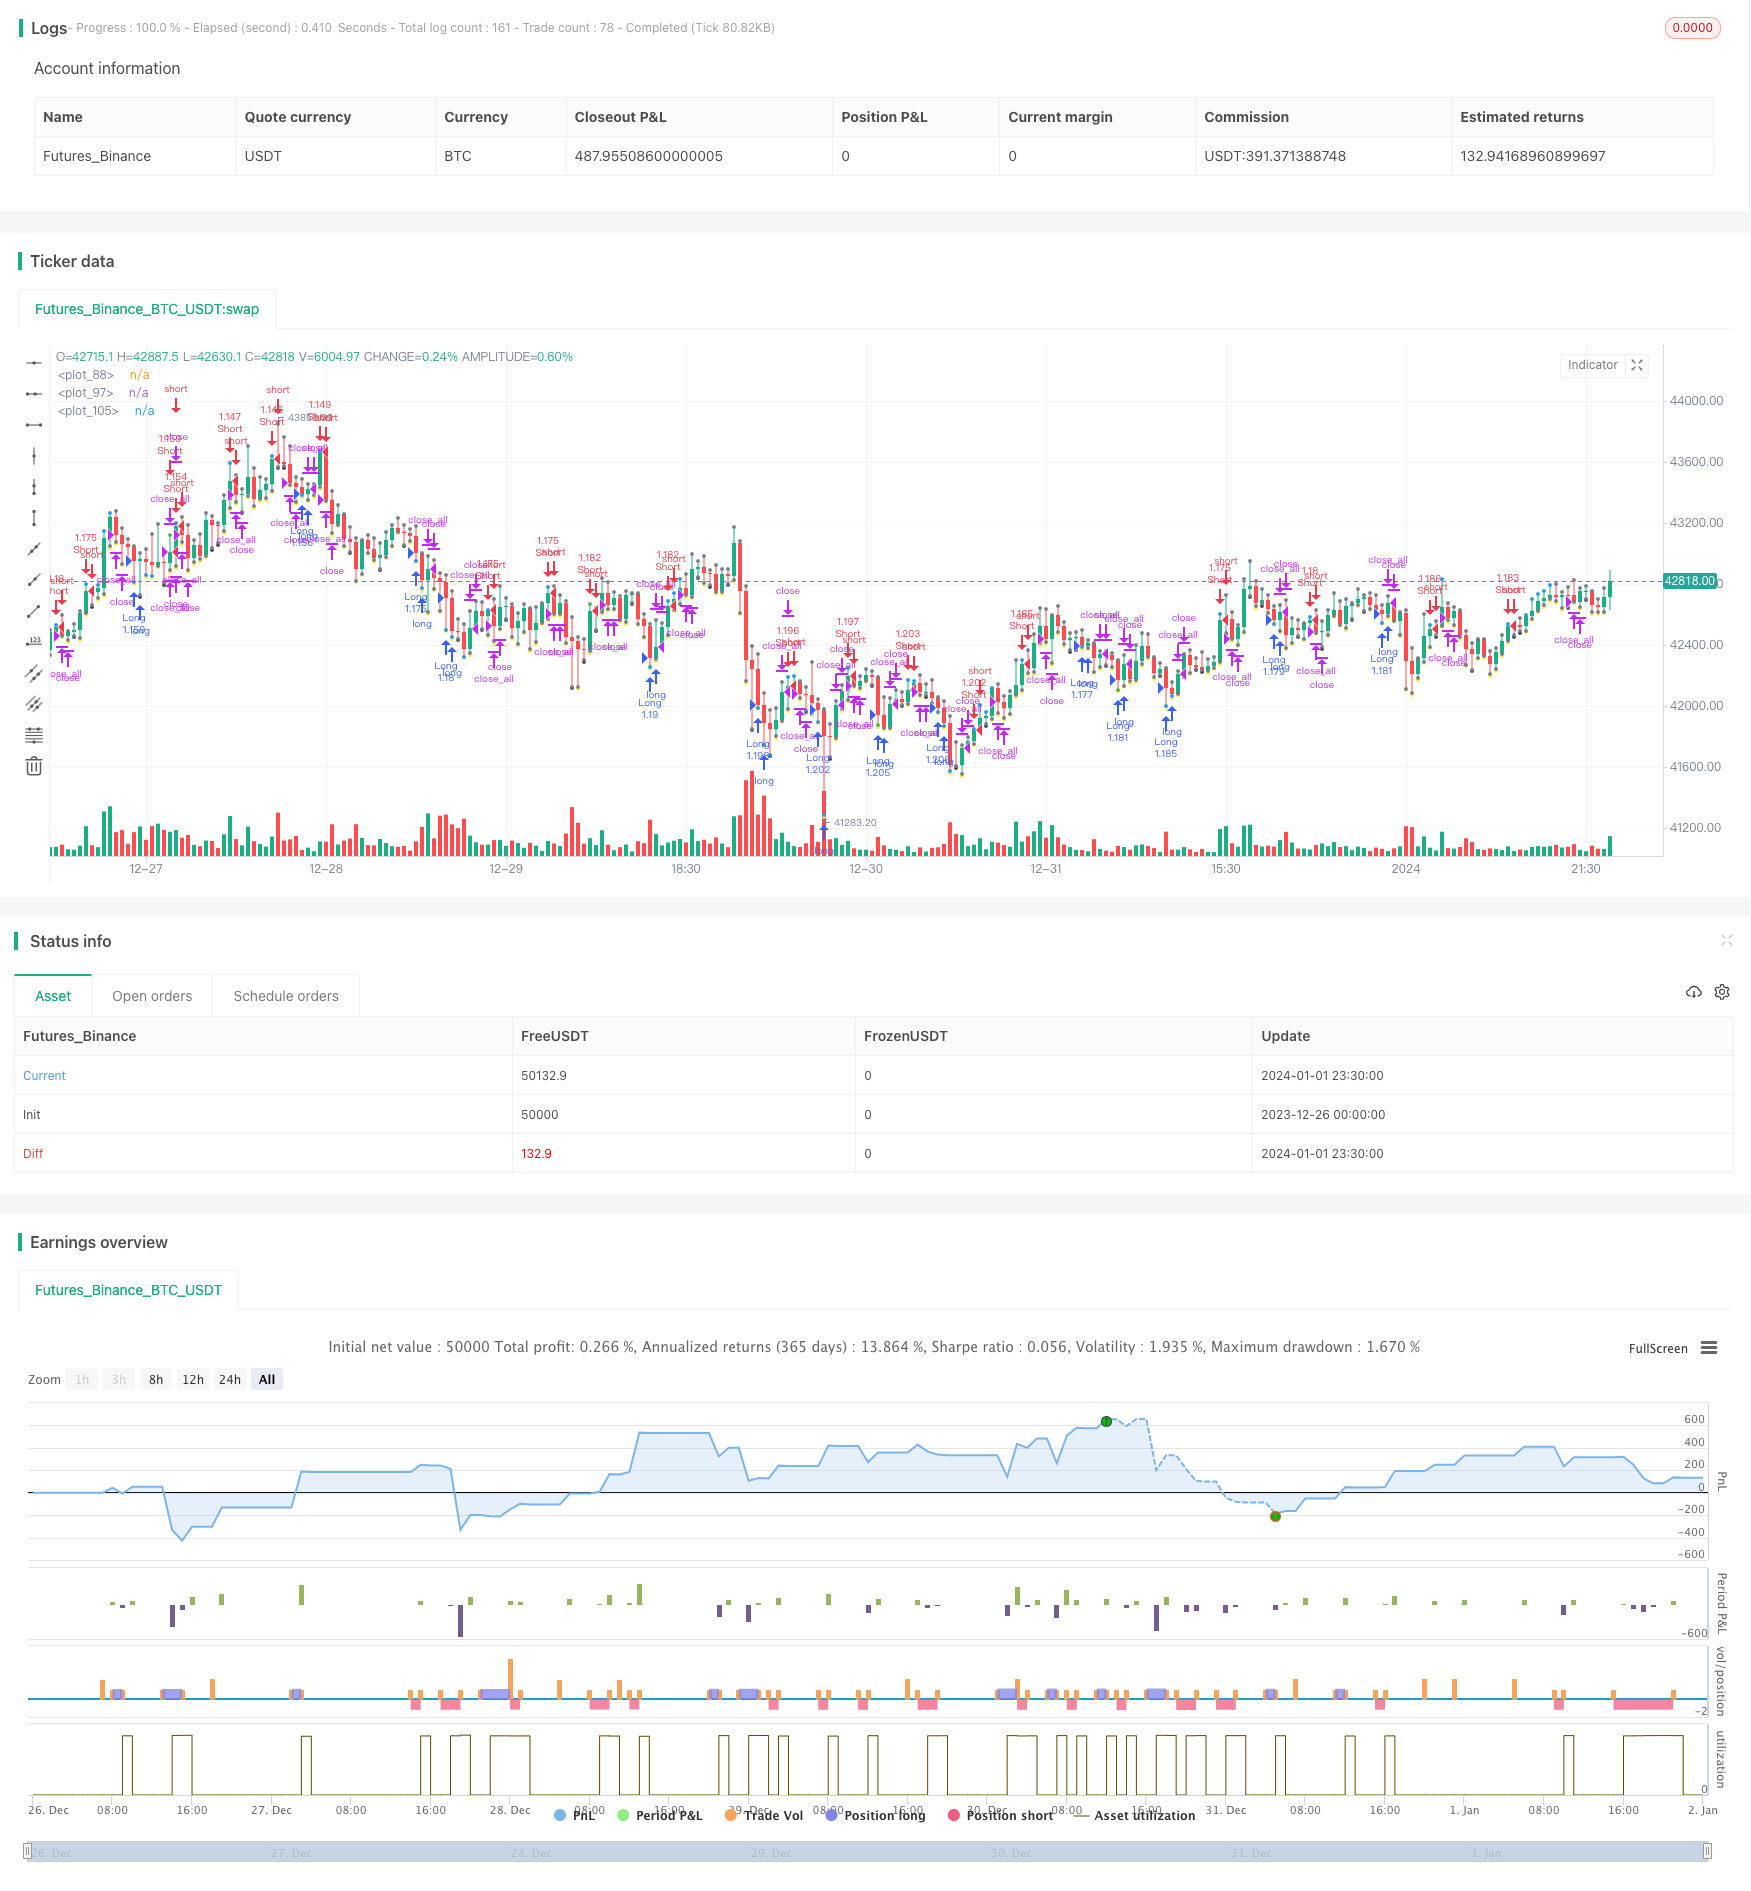
전략 원칙
현재 K선의 실체 길이를 판단하는 바디는, 지난 6개의 K선 바디의 평균값의 3배보다 크면, 의 의미 기둥선 이라고 본다.
연속적으로 3개의 의 의미 기둥 줄 줄이 모두 양선이라면, 다중선 신호로 판단한다. 연속적으로 3개의 의 의미 기둥 줄 줄이 모두 음선이라면, 공백 신호로 판단한다.
신호를 판단하는 동시에, 가격이 돌파하기 전에 고점이나 낮은 점이라면 추가적인 거래 신호가 발생한다.
SMA 평균선을 필터로 사용하여, 가격이 SMA를 돌파했을 때만 포지션을 열 수 있습니다.
포지션을 보유한 후, 가격이 다시 엔트리 포인트 또는 SMA 평균선을 돌파하면 평점 포지션이다.
우위 분석
의 의미줄을 사용하여 추세를 판단하고, 불필요한 간섭을 필터링하여 신호를 더 명확하게 만듭니다.
트렌드 신호와 브레이크 신호를 결합하여 신호 품질을 향상시키고 가짜 신호를 줄일 수 있다.
SMA 평행선 필터는 추격 하락을 방지한다. 클로징 아래에서 구매, 클로징 위에서 판매, 신호의 신뢰성을 증가한다.
스톱을 설정하면 스톱을 제때 중지할 수 있고, 자금보존에 도움이 된다.
위험 분석
이 전략은 3개의 K선으로 판단하는 신호를 사용하여, 짧은 기간의 흔들림을 트렌드 반전으로 오해할 수 있다.
테스트 데이터는 충분하지 않으며, 다른 품종과 다른 주기에서 효과가 다를 수 있습니다.
야간 디스크의 야간 포지션 제어에 가입하지 않은 경우, 야간 포지션 위험이 있습니다.
최적화 방향
의 의미 줄줄 의 매개 변수는 더 이상 최적화할 수 있다. 판단된 K선 수, 의 의미 의 정의 등이 있다.
다양한 주기 변수가 효과에 미치는 영향을 테스트할 수 있으며, 최적의 주기를 찾는다.
ATR을 추가하여 위험을 조절할 수 있다.
야간 포지션 제어 논리를 추가하는 것을 고려할 수 있다.
요약하다
이 전략은 의 의미 축선 필러 파동과 트렌드 판단을 이용하여, 파격 형성 거래 신호와 결합하여, 불필요한 작은 변동을 효과적으로 필터링 할 수 있으며, 신호는 더 명확하고 신뢰할 수 있습니다. 그러나 판단 주기가 짧기 때문에, 약간의 잘못된 판단 위험이있을 수 있습니다. 파라미터 최적화 및 풍력 제어 수단으로 더 개선 할 수 있습니다.
/*backtest
start: 2023-12-26 00:00:00
end: 2024-01-02 00:00:00
period: 30m
basePeriod: 15m
exchanges: [{"eid":"Futures_Binance","currency":"BTC_USDT"}]
*/

//AlexInc
//2018

// закрытие - вычислить и в течение скольки-то баров его добиваться
// если нет, то по первому противоположному
// по стоп-лоссу в любом случае - стоп вычислить

//@version=2
strategy(title = "AlexInc's Bar v1.2", shorttitle = "AlexInc Bar 1.2", overlay = true, default_qty_type = strategy.percent_of_equity, default_qty_value = 100, pyramiding = 0)

//Settings
needlong = input(true, defval = true, title = "Long")
needshort = input(true, defval = true, title = "Short")
usemar = input(false, defval = false, title = "Use Martingale")
tryprofitbars = input(6, defval = 6, minval = 1, maxval = 100, title = "Number of candles to take profit anyway")
capital = input(100, defval = 100, minval = 1, maxval = 10000, title = "Capital, %")

useSMAfilter = input(false, defval = true, title = "Use SMA filter")
SMAlimit = input(10, defval = 10, minval = 1, maxval = 30, title = "SMA filter limit")
bodysizeMlt = input(3, defval = 3, minval = 1, maxval = 10, title = "Body Size Multiplier")
meanfulbardiv = input(3, title = "Meanful Bar size Divider")

showarr = input(false, defval = false, title = "Show Arrows")
fromyear = input(2018, defval = 2018, minval = 1900, maxval = 2100, title = "From Year")
toyear = input(2100, defval = 2100, minval = 1900, maxval = 2100, title = "To Year")
frommonth = input(01, defval = 01, minval = 01, maxval = 12, title = "From Month")
tomonth = input(12, defval = 12, minval = 01, maxval = 12, title = "To Month")
fromday = input(01, defval = 01, minval = 01, maxval = 31, title = "From day")
today = input(31, defval = 31, minval = 01, maxval = 31, title = "To day")

//SMA #
index = 0
index := barstate.isfirst ==true ? 0 : nz(index[1])+1

buyindex = 0
buyindex := barstate.isfirst ==true ? 0 : buyindex[1]

sellindex = 0
sellindex := barstate.isfirst ==true ? 0 : sellindex[1]

//predictprofit = barstate.isfirst ==true ? 0 : predictprofit[1]

smafilter = sma(close, SMAlimit)

//Body
body = abs(close - open)
range = abs(high - low)
abody = sma(body, 6)

max3 = 0
if body >= body[1] and body >= body[2]
    max3 := body
else
    if body[1] >= body and body[1] >= body[2]
        max3 := body[1]
    else
        if body[2] >= body and body[2] >= body[1]
            max3 := body[2]

prevmax3 = 0
prevmax3 := nz(max3[1])


bar = close > open ? 1 : close < open ? -1 : 0
firstbullishopen = 0
firstbullishopen := bar == 1 and bar[1] != 1 ? open : nz(firstbullishopen[1])
firstbearishopen = 0
firstbearishopen := bar == -1 and bar[1] != -1 ? open : nz(firstbearishopen[1])

meanfulbar = body > abody / meanfulbardiv

meanfulbearish = 0
meanfulbearish := nz(meanfulbearish[1])

meanfulbullish = 0
meanfulbullish := nz(meanfulbullish[1])

if meanfulbar
    if bar == 1
        meanfulbullish := 1 + meanfulbullish
        meanfulbearish := 0
    else
        if bar == -1
            meanfulbearish := 1 + meanfulbearish
            meanfulbullish := 0


plot(min(low, high)-10, style=circles, color = meanfulbar ? yellow:black, linewidth=3)

//Signals
up1 = (meanfulbearish >= 3) and (close < firstbullishopen or 1) and (strategy.position_size == 0 or close < strategy.position_avg_price) and body > abody / 5 and (useSMAfilter == false or close < smafilter)
if up1 == true
	predictprofit = sma(body, 3)
up2 = sma(bar, 1) == -1 and body > prevmax3 * bodysizeMlt and (strategy.position_size == 0 or close < strategy.position_avg_price) and body > abody / 5 and (useSMAfilter == false or close < smafilter)
if up2 == true
	predictprofit = body * 0.5
plot(min(low, high), style=circles, color = up1?blue:up2?green:gray, linewidth=3)

dn1 = (meanfulbullish >= 3) and (close > firstbearishopen or 1)  and (strategy.position_size == 0 or close > strategy.position_avg_price) and body > abody / 5 and (useSMAfilter==false or close > smafilter)
if dn1 ==true
	predictprofit = sma(body, 3)
dn2 = sma(bar, 1) == 1 and body > prevmax3 * bodysizeMlt and (strategy.position_size == 0 or close > strategy.position_avg_price) and body > abody / 5 and (useSMAfilter==false or close > smafilter)
if dn2 ==true
	predictprofit = body * 0.5
plot(max(low, high), style=circles, color = dn1?blue:dn2?green:gray, linewidth=3)


exit = (((strategy.position_size > 0 and bar == 1 ) or (strategy.position_size < 0 and bar == -1)) and body > abody / 2 )
// or index >= buyindex (or sellindex) + tryprofitbars


//Arrows
col = exit ? black : up1 or dn1 ? blue : up2 or dn2 ? red : na
needup = up1 or up2
needdn = dn1 or dn2
needexitup = exit and strategy.position_size < 0
needexitdn = exit and strategy.position_size > 0
plotarrow(showarr and needup ? 1 : na, colorup = blue, colordown = blue, transp = 0)
plotarrow(showarr and needdn ? -1 : na, colorup = blue, colordown = blue, transp = 0)
plotarrow(showarr and needexitup ? 1 : na, colorup = black, colordown = black, transp = 0)
plotarrow(showarr and needexitdn ? -1 : na, colorup = black, colordown = black, transp = 0)


//Trading
profit = exit ? ((strategy.position_size > 0 and close > strategy.position_avg_price) or (strategy.position_size < 0 and close < strategy.position_avg_price)) ? 1 : -1 : profit[1]
mult = usemar ? exit ? profit == -1 ? mult[1] * 2 : 1 : mult[1] : 1
lot = strategy.position_size == 0 ? strategy.equity / close * capital / 100 * mult : lot[1]

if up1 or up2
    if strategy.position_size < 0
        strategy.close_all()
		buyindex = index
		sellindex = index
	if strategy.position_size == 0
		buyindex = index


    strategy.entry("Long", strategy.long, needlong == false ? 0 : lot )

if dn1 or dn2
    if strategy.position_size > 0
        strategy.close_all()
		buyindex = index
		sellindex = index
	if strategy.position_size == 0
		sellindex = index

    strategy.entry("Short", strategy.short, needshort == false ? 0 : lot )

if  exit
    strategy.close_all()