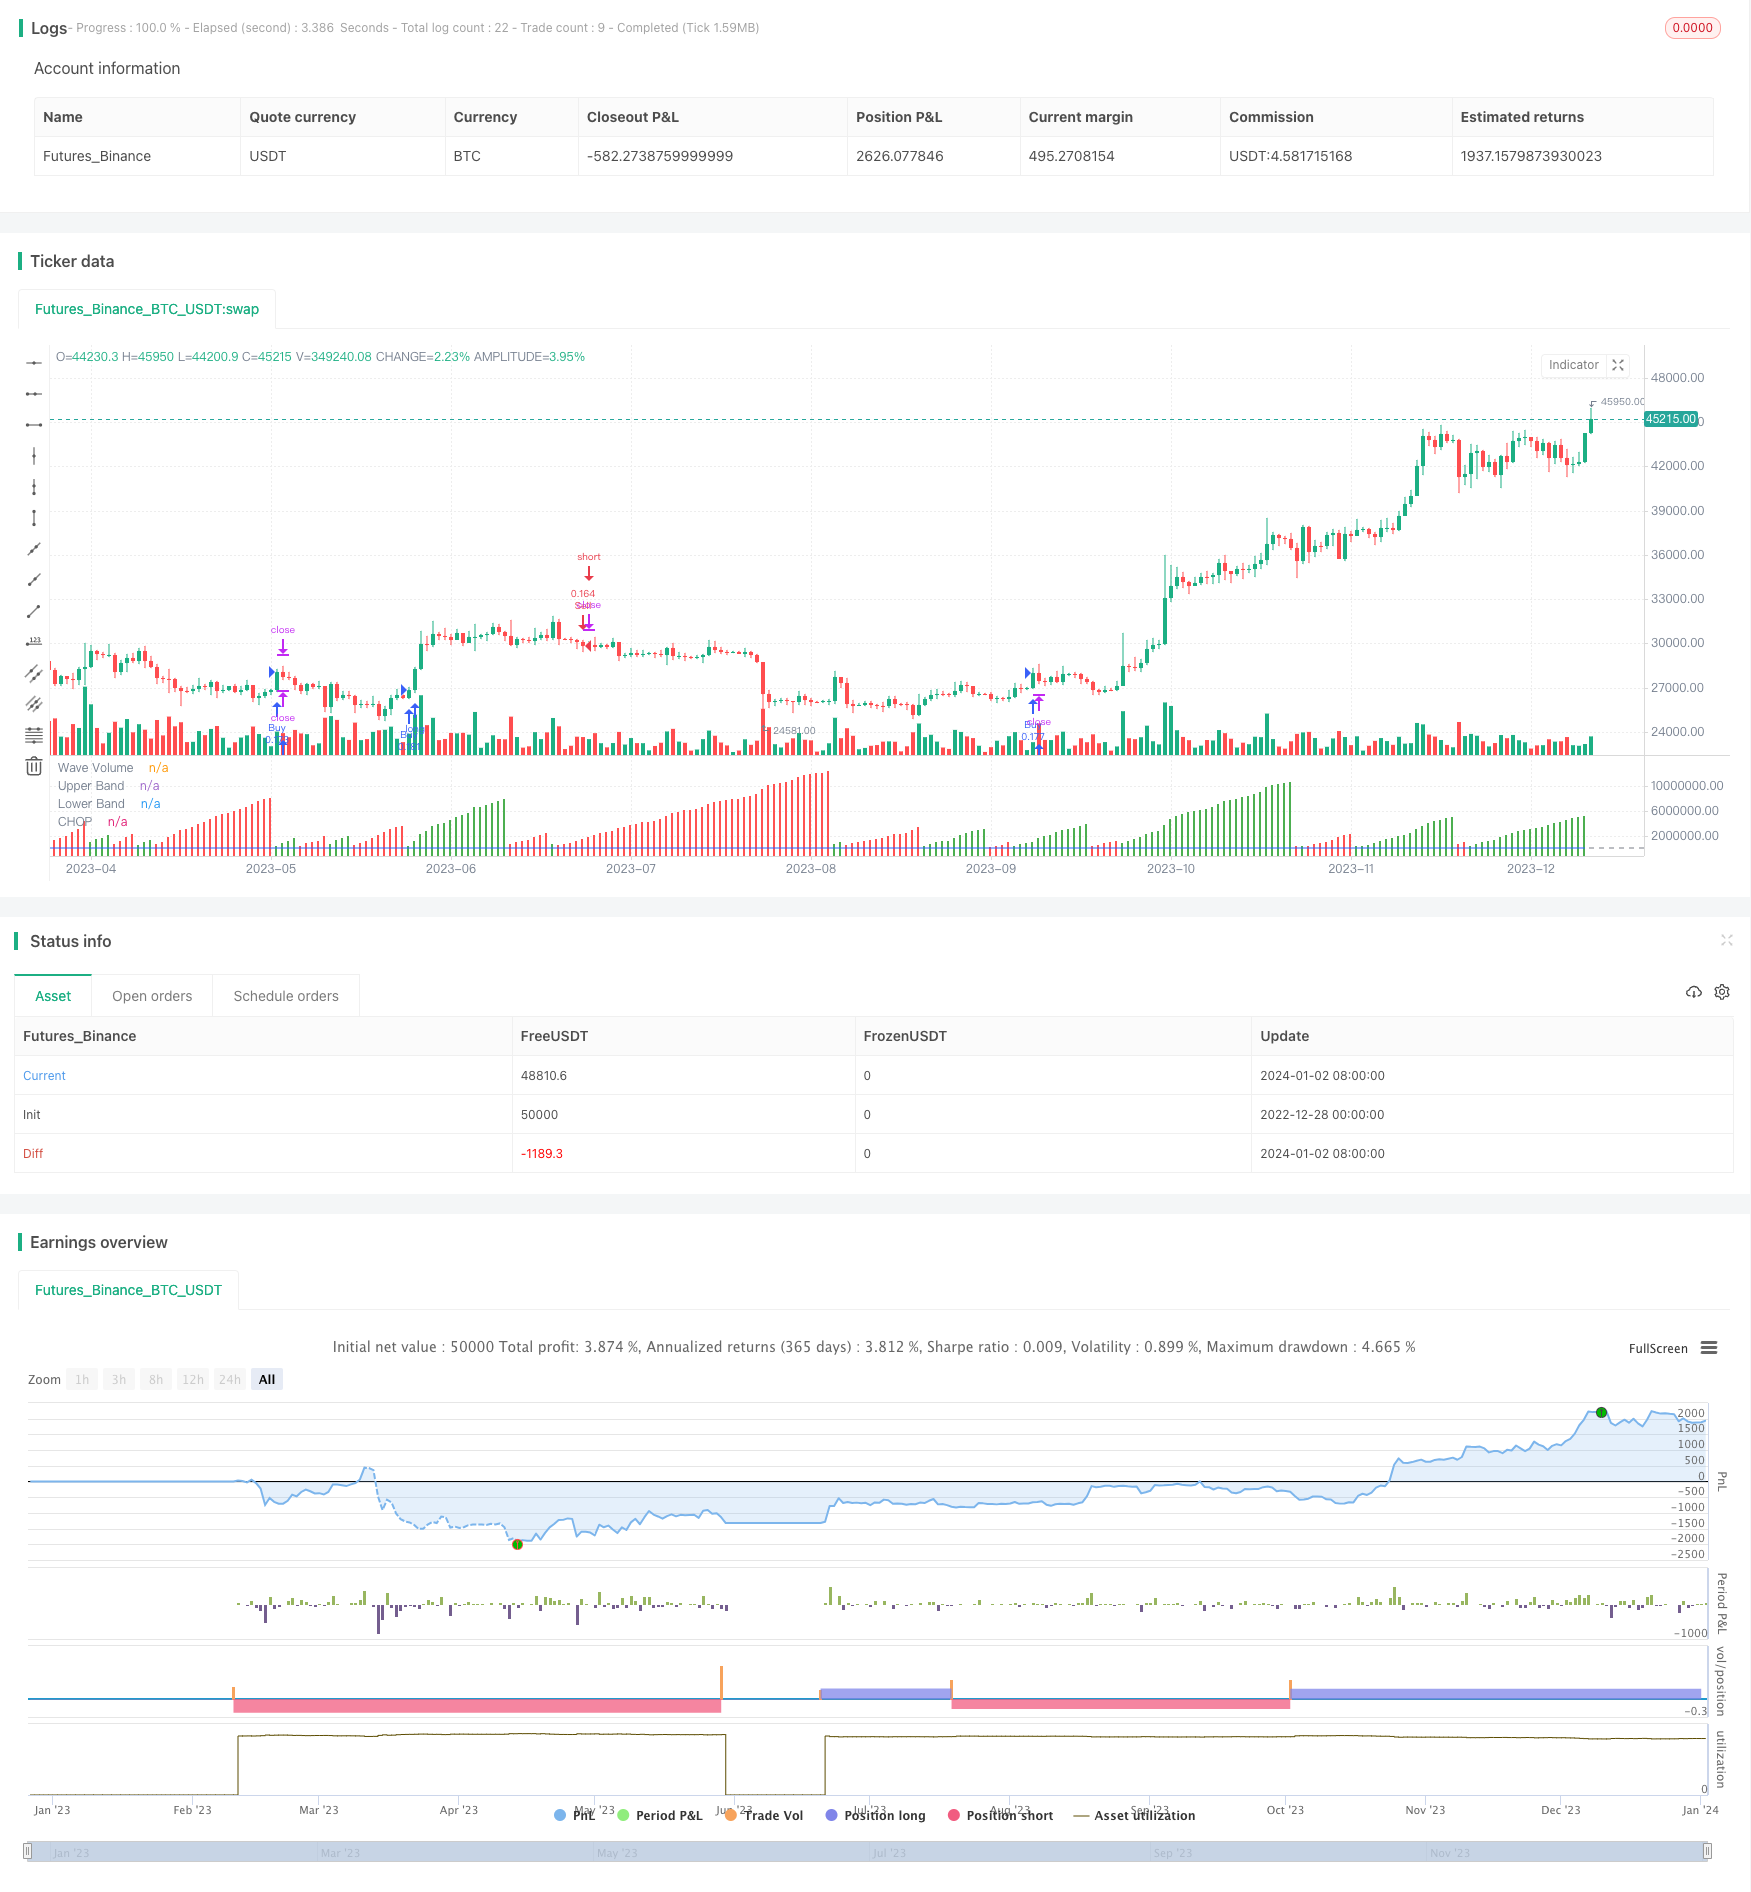
개요
이 전략은 평균 실제 진폭 (ATR) 과 변동성 지수 (CHOP) 를 주요 기술 지표로 사용하여 트렌드를 식별하고 추적합니다. 지수가 경로를 돌파 할 때, 트렌드 방향과 결합하여 진입 신호로; 지수가 반지형 영역으로 다시 들어갈 때, 중단 또는 중단 퇴출 위치를 취합니다.
전략 원칙
- ATR을 사용하여 선체 크기를 계산하고, 리포크 통로를 구성하고, 가격 경향 방향을 판단한다.
- CHOP 지표는 최고 가격, 최저 가격과 ATR을 결합하여 38.2-61.8의 범위에있는 경우 시장의 변동이 느린 것을 나타냅니다. 그렇지 않으면 시장의 변동이 큰 것을 나타냅니다. 거래는 적합하지 않습니다.
- CHOP 지표가 61.8의 상반에서 아래로 돌파할 때, 가격이 하향 트렌드에 들어갑니다. 단기 빠른 EMA가 가격 선두를 보여주면, 공백을 냅니다. 반대로 CHOP가 38.2의 하반에서 상반에서 돌파하고 단기 EMA가 가격 상승을 할 때, 더 많은 것을 합니다.
- CHOP의 38.2-61.8의 반지방으로 다시 들어가면 스톱 또는 스톱하는 스톱 스톱 전략을 사용하십시오.
전략적 강점 분석
이 전략은 트렌드 판단과 변동성 통제를 결합하여 가격 트렌드를 포착하고 위험을 통제하는 비교적 안정적인 트렌드 추적 전략이다.
- ATR에서 구축된 리포크 채널을 적용하여 가격 동향을 효과적으로 추적할 수 있다.
- CHOP 지표는 시장의 변동률을 판단하여 급격한 변동 속에서 잘못된 거래를 피합니다.
- 빠른 EMA와 결합하여 단기 트렌드 방향을 판단하여 역전을 피하십시오.
- 단편적 손실을 제어하는 스톱 스톱 손실 전략.
위험 분석
이 전략의 주요 위험은 다음과 같습니다.
- 진동상황에서 ATR 채널과 CHOP 지표는 잘못된 신호를 생성할 수 있다. 잘못된 신호를 제거하기 위해 파라미터를 적절히 조정할 수 있다.
- 단 하나의 기술 지표 포지션은 손실을 완전히 피할 수 없으며, 큰 추세를 결정하는 인적 개입이 필요합니다.
- 중지 손실 위치 설정이 너무 느리고, 단일 손실이 너무 커질 수 있습니다. 중지 손실을 적절히 줄여야합니다.
전략 최적화 방향
이 전략은 다음과 같은 부분에서 최적화될 수 있습니다.
- 다른 보조 지표 판단 신호를 추가하여 신호의 정확도를 향상시킵니다.
- ATR와 CHOP의 변수를 최적화하여 가격 변동을 더 잘 포착합니다.
- 다이내믹 스톱포지션을 설정하여 스톱공간을 넓히고 스톱포지션을 빠르게 설정한다.
- 큰 규모의 트렌드를 판단한 후, 트렌드에서 더 많은 수익을 얻기 위해 적절하게 중지 범위를 완화하십시오.
요약하다
이 전략은 일반적으로 사용되는 기술 지표를 통합하고 간단하고 실용적입니다. 변수 조정 최적화 하에서 좋은 추적 효과를 얻을 수 있습니다. 그러나 여전히 큰 추세를 인력으로 판단해야하며 완전히 자동화 할 수 없습니다. 보조 의사 결정 도구로 사용할 수 있으며 다른 전략에 대한 참고 자료로도 사용할 수 있습니다.
전략 소스 코드
/*backtest
start: 2022-12-28 00:00:00
end: 2024-01-03 00:00:00
period: 1d
basePeriod: 1h
exchanges: [{"eid":"Futures_Binance","currency":"BTC_USDT"}]
*/

// This source code is subject to the terms of the Mozilla Public License 2.0 at https://mozilla.org/MPL/2.0/
// © sharatgbhat

//@version=4
strategy("Weis Chop Strategy", overlay=false, default_qty_type = strategy.percent_of_equity, default_qty_value = 10,max_lines_count = 500, max_labels_count = 500)
maxIdLossPcnt = input(1, "Max Intraday Loss(%)", type=input.float)
// strategy.risk.max_intraday_loss(maxIdLossPcnt, strategy.percent_of_equity)

method = input(defval="ATR", options=["ATR", "Traditional", "Part of Price"], title="Renko Assignment Method")
methodvalue = input(defval=14.0, type=input.float, minval=0, title="Value")
pricesource = input(defval="Close", options=["Close", "Open / Close", "High / Low"], title="Price Source")
useClose = pricesource == "Close"
useOpenClose = pricesource == "Open / Close" or useClose
useTrueRange = input(defval="Auto", options=["Always", "Auto", "Never"], title="Use True Range instead of Volume")
isOscillating = input(defval=false, type=input.bool, title="Oscillating")
normalize = input(defval=false, type=input.bool, title="Normalize")
vol = useTrueRange == "Always" or useTrueRange == "Auto" and na(volume) ? tr : volume
op = useClose ? close : open
hi = useOpenClose ? close >= op ? close : op : high
lo = useOpenClose ? close <= op ? close : op : low

if method == "ATR"
    methodvalue := atr(round(methodvalue))
if method == "Part of Price"
    methodvalue := close / methodvalue

currclose = float(na)
prevclose = nz(currclose[1])
prevhigh = prevclose + methodvalue
prevlow = prevclose - methodvalue
currclose := hi > prevhigh ? hi : lo < prevlow ? lo : prevclose

direction = int(na)
direction := currclose > prevclose ? 1 : currclose < prevclose ? -1 : nz(direction[1])
directionHasChanged = change(direction) != 0
directionIsUp = direction > 0
directionIsDown = direction < 0

barcount = 1
barcount := not directionHasChanged and normalize ? barcount[1] + barcount : barcount
vol := not directionHasChanged ? vol[1] + vol : vol
res = barcount > 1 ? vol / barcount : vol

plot(isOscillating and directionIsDown ? -res : res, style=plot.style_columns, color=directionIsUp ? color.green : color.red, transp=75, linewidth=3, title="Wave Volume")

length = input(14, minval=1)
ci = 100 * log10(sum(atr(1), length) / (highest(length) - lowest(length))) / log10(length)
offset = input(0, "Offset", type = input.integer, minval = -500, maxval = 500)
plot(ci, "CHOP", color=#2962FF, offset = offset)
band1 = hline(61.8, "Upper Band", color=#787B86, linestyle=hline.style_dashed)
band0 = hline(38.2, "Lower Band", color=#787B86, linestyle=hline.style_dashed)
fill(band1, band0, color = color.rgb(33, 150, 243, 90), title = "Background")

MomentumBull = close>ema(close,8)
MomentumBear = close<ema(close,8)
Tradecon = crossunder(ci,61.8)

if (MomentumBull and directionIsUp and Tradecon)
	strategy.entry("Buy", strategy.long)
if (MomentumBear and directionIsDown and Tradecon )
    strategy.entry("Sell", strategy.short)
    strategy.exit("exit","Buy",when=directionIsDown,qty_percent=100,profit=20,loss=10)
    strategy.exit("exit","Sell",when=directionIsUp,qty_percent=100,profit=20,loss=10)