개요
이 전략은 브린 대역 ((BB) 과 전형적인 가격량 평균 (VWAP) 두 지표를 결합하여 구매 및 판매 결정을 내립니다. 짧은 기간의 가격 이상성을 발견하고 거래를 할 수 있으며 짧은 기간의 거래에 적합합니다.
전략 원칙
이 전략은 다음과 같은 몇 가지 규칙에 따라 구매 및 판매를 수행합니다.
빠른 EMA 라인이 느린 EMA 라인보다 높다는 것은 트렌드를 판단하는 전제 조건입니다.
VWAP보다 클로즈오프가 높을 때 가격 상승으로 판단하고 구매
10 K 선의 1개 선이 부린 하차선보다 하락한 경우 비정상적인 가격으로 매입된다고 판단한다.
부린이 상위권에 도달했을 때, 부린이 상위권에 도달했을 때, 부린이 상위권에 도달했을 때, 부린이 상위권에 도달했을 때, 부린이 상위권에 도달했을 때, 부린이 상위권에 도달했을 때, 부린이 상위권에 도달했을 때
구체적으로, 전략은 먼저 50일 EMA가 200일 EMA보다 높다고 판단하고, 빠른 느린 EMA를 사용하여 큰 트렌드를 판단한다. 그리고 VWAP와 결합하여 가격이 단기간에 상승 추세에 있는지 판단한다. 마지막으로 부린 대역을 사용하여 가격이 단기간에 비정상적인 하락이 발생했는지 판단한다.
출구 규칙은 간단합니다. 즉, 가격이 부린을 가로질러 올라갈 때, 가격이 반전되어 퇴출됩니다.
우위 분석
이 전략은 여러 지표의 가격 판단의 이상성을 결합하여 엔트리 신호의 효과를 높일 수 있습니다. EMA를 사용하여 큰 추세를 판단하면 역동적인 동작을 피할 수 있습니다. VWAP와 결합하면 단기 가격 상승 기회를 잡을 수 있습니다.
위험 분석
- EMA는 대동향 판단이 역동적인 대장 운영으로 이어질 수 없다고 판단했다.
- VWAP 지표는 시간 단위 또는 일간 데이터 효과에 가장 적합하며 일선 데이터 효과에 사용할 경우 할인됩니다.
- 부린 밴드 파라미터가 잘못 설정되어 있고, 상하 레일의 제한이 너무 넓거나 너무 좁으면 신호가 오차됩니다.
이러한 위험에 대해, 적절하게 EMA 주기 변수를 조정하거나 다른 큰 추세를 판단하는 지표를 시도할 수 있다. VWAP 변수는 일일 데이터에 적용되거나 다른 단선 지표로 조정한다. 브린 밴드 변수를 조정하여 최적의 폭을 찾는다.
최적화 방향
- MACD와 같은 다른 지표로 큰 트렌드를 판단해보세요.
- 최적화된 EMA와 브린 밴드 파라미터를 찾습니다.
- 손해 방지 장치
- 다른 지표와 함께 가짜 신호를 필터링
- 다양한 품종과 주기 데이터를 테스트합니다.
요약하다
이 전략은 브린밴드와 VWAP 두 지표를 결합하여 단기 가격 비정상성을 진입 시점으로 판단한다. EMA를 사용하여 큰 추세를 판단하여 역동적인 동작을 피한다. 단선 가격 추세 기회를 신속하게 발견할 수 있다. 일내 및 단선 거래에 적용된다.
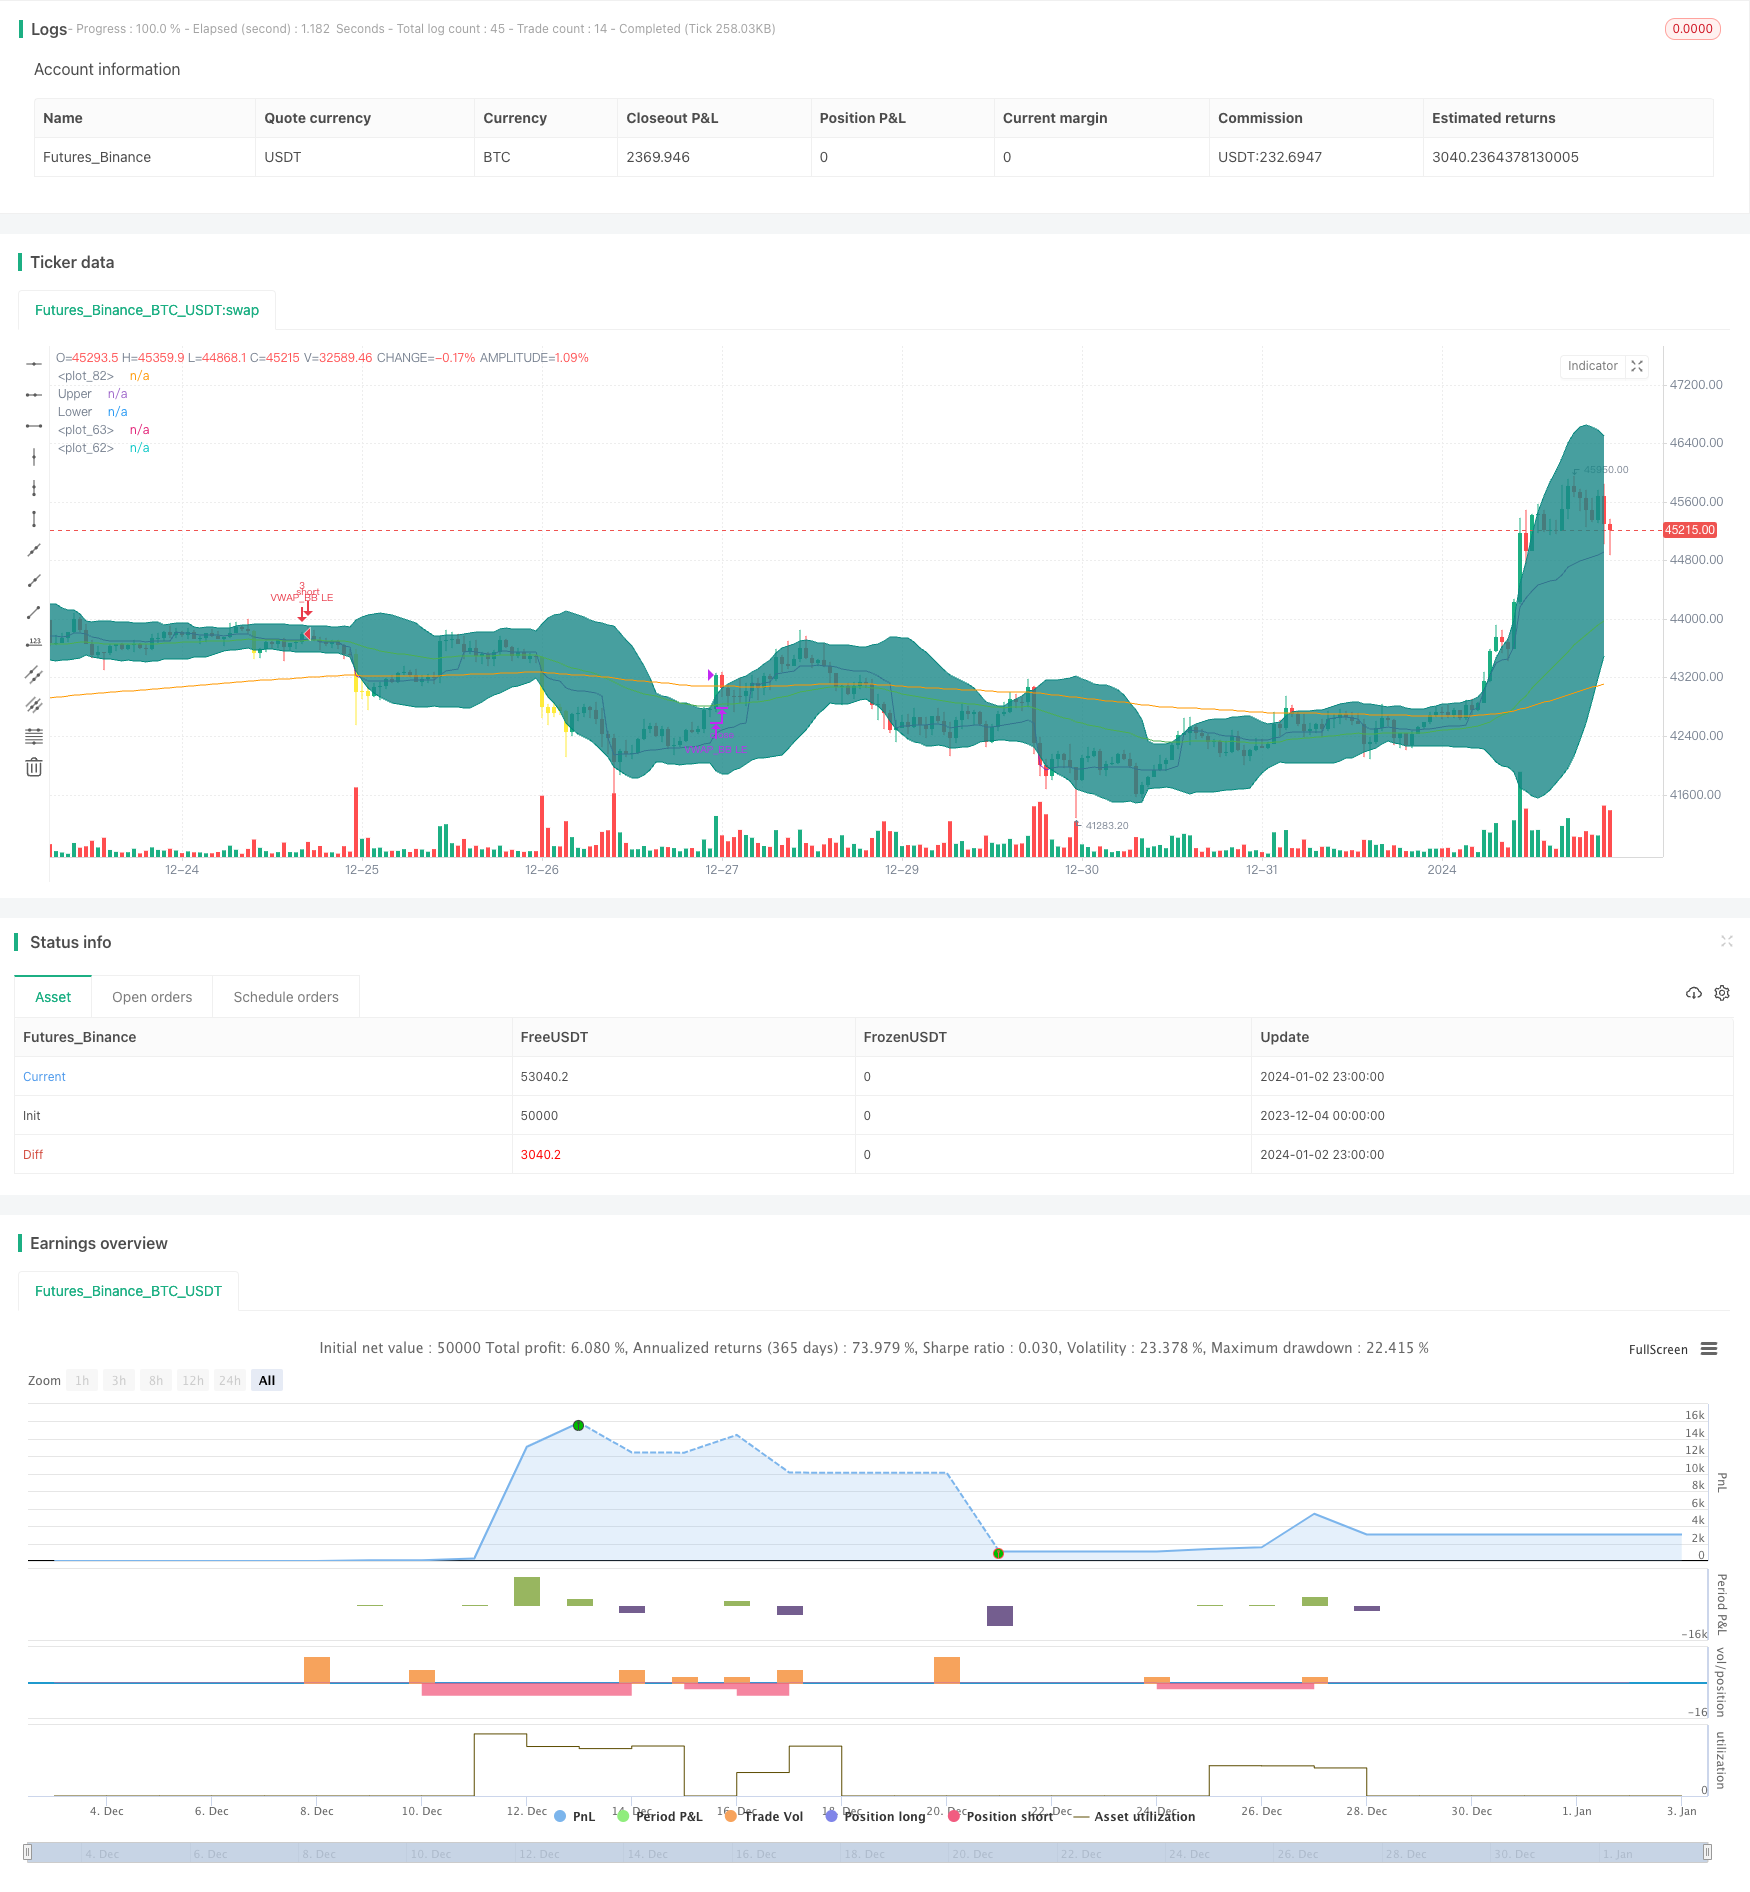
/*backtest
start: 2023-12-04 00:00:00
end: 2024-01-03 00:00:00
period: 1h
basePeriod: 15m
exchanges: [{"eid":"Futures_Binance","currency":"BTC_USDT"}]
*/

// This source code is subject to the terms of the Mozilla Public License 2.0 at https://mozilla.org/MPL/2.0/
// © mohanee

//@version=4
strategy(title="VWAP and BB strategy [EEMANI]", overlay=true,pyramiding=2, default_qty_value=3, default_qty_type=strategy.fixed,    initial_capital=10000, currency=currency.USD)
//This strategy combines VWAP and BB indicators
//BUY RULE
//1. EMA50 > EMA 200
//2. if current close > vwap session  value
//3. check if  price dipped BB lower band for any of last 10 candles
//EXIT RULE
//1. price closes above BB upper band
//STOP LOSS EXIT
//1. As configured --- default is set to 5%

is_price_dipped_bb(pds,source1) =>
    t_bbDipped=false
    for i=1 to pds
        t_bbDipped:=  (t_bbDipped   or  close[i]<source1) ? true : false
        if t_bbDipped==true
            break
        else
            continue

    t_bbDipped

// variables  BEGIN
shortEMA = input(50, title="fast EMA", minval=1)
longEMA = input(200, title="slow EMA", minval=1)

//BB

smaLength = input(20, title="BB SMA Length", minval=1)
bbsrc = input(close, title="BB Source")


//addOnDivergence = input(true,title="Add to existing on Divergence")
//exitOption = input(title="exit on RSI or BB", type=input.string, options=["RSI", "BB"],      defval="BB")

//bbSource = input(title="BB  source", type=input.string, options=["close", "vwap"],      defval="close")

//vwap_res = input(title="VWAP Resolution", type=input.resolution, defval="session")
stopLoss = input(title="Stop Loss%", defval=5, minval=1)

//variables  END


longEMAval= ema(close, longEMA)
shortEMAval= ema(close, shortEMA)


vwapVal=vwap(close)


// Drawings

//plot emas
plot(longEMAval, color = color.orange, linewidth = 1, transp=0)
plot(shortEMAval, color = color.green, linewidth = 1, transp=0)


//bollinger calculation
mult = input(2.0, minval=0.001, maxval=50, title="StdDev")
basis = sma(bbsrc, smaLength)
dev = mult * stdev(bbsrc, smaLength)
upperBand = basis + dev
lowerBand = basis - dev
offset = input(0, "Offset", type = input.integer, minval = -500, maxval = 500)
//bollinger calculation

//plot bb
//plot(basis, "Basis", color=#872323, offset = offset)
p1 = plot(upperBand, "Upper", color=color.teal, offset = offset)
p2 = plot(lowerBand, "Lower", color=color.teal, offset = offset)
fill(p1, p2, title = "Background", color=#198787, transp=95)


plot(vwapVal, color = color.purple, linewidth = 1, transp=0)


// Colour background

barcolor(shortEMAval>longEMAval and close<=lowerBand ? color.yellow: na)


//longCondition=  shortEMAval > longEMAval and  close>open and  close>vwapVal
longCondition= shortEMAval >= longEMAval  and  close>=vwapVal and close>open  //      close>vwapVal   and


//Entry
strategy.entry(id="VWAP_BB LE", comment="VB LE" , long=true,  when= longCondition and  is_price_dipped_bb(10,lowerBand) )  //and strategy.position_size<1

//add to the existing position
//strategy.entry(id="VWAP_RSI LE", comment="VR LE Add" , long=true,  when= addOnDivergence==true and strategy.position_size>=1 and close<strategy.position_avg_price   and (close<lowerBand or  low<lowerBand) and rsiVal>rsi_buy_line)

barcolor(strategy.position_size>=1  ? color.blue: na)


strategy.close(id="VWAP_BB LE", comment="TP Exit VB LE",   when=crossover(close,upperBand) )

//stoploss
stopLossVal =   strategy.position_avg_price * (1-(stopLoss*0.01) )
strategy.close(id="VB LE", comment="SL Exit",   when= close < stopLossVal)