개요
이 전략은 하나의 곡선, 일 K선, 헐 이동 평균, MACD 지표와 같은 여러 지표들을 통합하여, 긴 짧은 다중 허공 의사결정 메커니즘을 구축하여, 자동 거래를 구현한다.
전략 원칙
이치모쿠 클라우드 밴드의 전환선과 지연선을 기반으로 다공간 거래 신호를 구축한다. 헐 이동 평균과 결합하여 트렌드 방향을 판단한다. MACD 지표를 사용하여 긴 짧은 속도를 판단한다. 일내 K선 판단 돌파구를 입시 신호로 판단한다.
전환선은 거의 9일간의 중간값의 평균이다. 지연선은 거의 26일간의 중간값의 평균이다. 전환선 상에서 지연선을 통과할 때, 더 많이 한다. 전환선 아래에서 지연선을 통과할 때, 공백한다.
헐 이동 평균은 쌍 평균을 교차하여 추세를 판단하며, 빠른 선이 느린 선을 통과하면 상승 추세로 판단하고, 반대로, dann은 하락 추세로 판단한다.
MACD는 12과 26 지수 이동 평균의 차이를 가지고, 0축과 평균의 황금 叉死叉을 통해 다공평을 판단한다.
일안 K 라인이 지연선을 뚫고 진입 시간으로 니다.
전략적 이점
- 트렌드 방향에 대한 정확한 판단을 위해 여러 지표를 통합한다.
- 선택에 주의를 기울이고, 불필요한 거래를 피하십시오.
- 리스크가 통제되고, 제약 장치가 멈췄다.
전략적 위험
- 매개 변수가 잘못 설정되면 과도하게 격렬하게 진입할 수 있다.
- 다중 지표 조합은 전략적 복잡성을 증가시킵니다.
- 단선 운영은 철회될 수 밖에 없다.
전략 최적화
- 더 많은 품종과 주기들을 위해 변수 조합을 조정한다.
- 기계 학습 모듈을 추가하여 파라미터 적응을 구현한다.
- 승률을 높이기 위해 경기 출전 동력 지표를 최적화하십시오.
요약하다
이 전략은 이치모쿠 클라우드 띠와 같은 여러 지표 신호를 결합하여 전체적인 정량적 의사 결정 시스템을 구축한다. 엄격한 스톱 로즈 스톱 메커니즘은 거래 위험을 제어한다. 매개 변수 조정 및 모델 최적화를 통해 더 많은 거래 품종에 적응할 수 있으며 광범위한 응용 전망을 가지고 있다.
전략 소스 코드
/*backtest
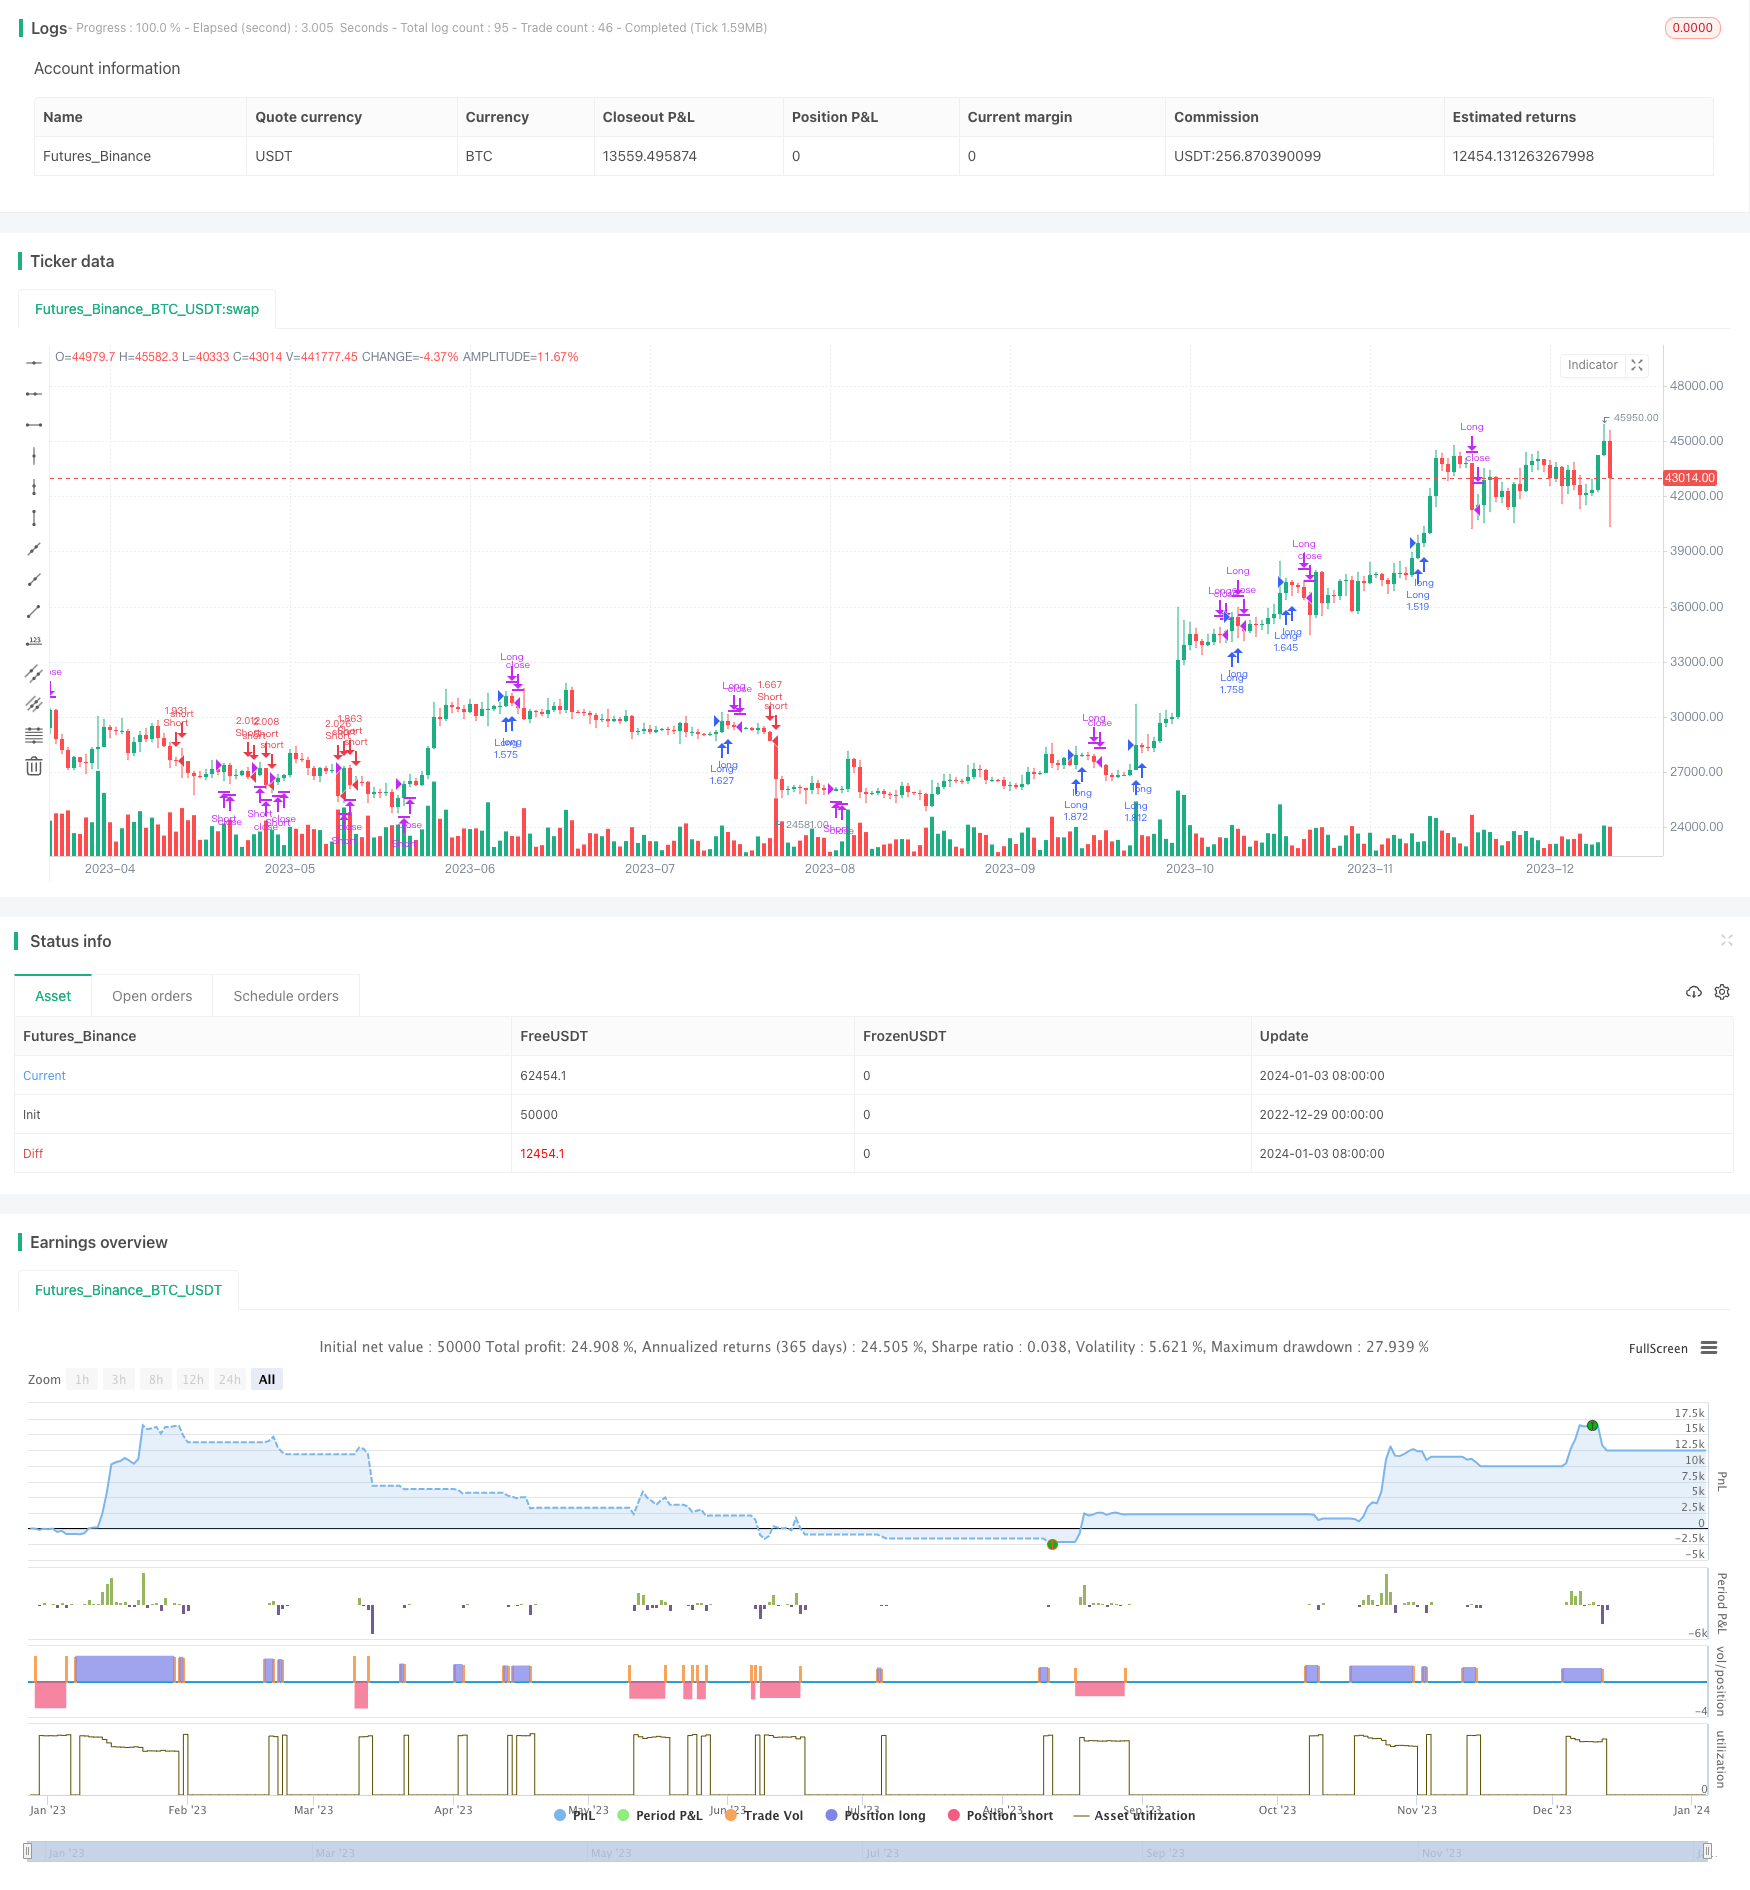
start: 2022-12-29 00:00:00
end: 2024-01-04 00:00:00
period: 1d
basePeriod: 1h
exchanges: [{"eid":"Futures_Binance","currency":"BTC_USDT"}]
*/
//@version=2
// Any timeFrame ok but good on 15 minute & 60 minute , Ichimoku + Daily-Candle_cross(DT) + HULL-MA_cross + MacD combination 420 special blend
strategy("Ichimoku + Daily-Candle_X + HULL-MA_X + MacD", shorttitle="٩(̾●̮̮̃̾•̃̾)۶", overlay=true, default_qty_type=strategy.percent_of_equity, max_bars_back=720, default_qty_value=100, calc_on_order_fills= true, calc_on_every_tick=true, pyramiding=0)
keh=input(title="Double HullMA",defval=14, minval=1)
dt = input(defval=0.0010, title="Decision Threshold (0.001)", type=float, step=0.0001)
SL = input(defval=-500.00, title="Stop Loss in $", type=float, step=1)
TP = input(defval=25000.00, title="Target Point in $", type=float, step=1)
ot=1
n2ma=2*wma(close,round(keh/2))
nma=wma(close,keh)
diff=n2ma-nma
sqn=round(sqrt(keh))
n2ma1=2*wma(close[1],round(keh/2))
nma1=wma(close[1],keh)
diff1=n2ma1-nma1
sqn1=round(sqrt(keh))
n1=wma(diff,sqn)
n2=wma(diff1,sqn)
b=n1>n2?lime:red
c=n1>n2?green:red
d=n1>n2?red:green
confidence=(request.security(syminfo.tickerid, 'D', close)-request.security(syminfo.tickerid, 'D', close[1]))/request.security(syminfo.tickerid, 'D', close[1])
conversionPeriods = input(9, minval=1, title="Conversion Line Periods")
basePeriods = input(26, minval=1, title="Base Line Periods")
laggingSpan2Periods = input(52, minval=1, title="Lagging Span 2 Periods")
displacement = input(26, minval=1, title="Displacement")
donchian(len) => avg(lowest(len), highest(len))
conversionLine = donchian(conversionPeriods)
baseLine = donchian(basePeriods)
leadLine1 = avg(conversionLine, baseLine)
leadLine2 = donchian(laggingSpan2Periods)
LS=close, offset = -displacement
MACD_Length = input(9)
MACD_fastLength = input(12)
MACD_slowLength = input(26)
MACD = ema(close, MACD_fastLength) - ema(close, MACD_slowLength)
aMACD = ema(MACD, MACD_Length)
closelong = n1<n2 and close<n2 and confidence<dt or strategy.openprofit<SL or strategy.openprofit>TP
if (closelong)
strategy.close("Long")
closeshort = n1>n2 and close>n2 and confidence>dt or strategy.openprofit<SL or strategy.openprofit>TP
if (closeshort)
strategy.close("Short")
longCondition = n1>n2 and strategy.opentrades<ot and confidence>dt and close>n2 and leadLine1>leadLine2 and open<LS and MACD>aMACD
if (longCondition)
strategy.entry("Long",strategy.long)
shortCondition = n1<n2 and strategy.opentrades<ot and confidence<dt and close<n2 and leadLine1<leadLine2 and open>LS and MACD<aMACD
if (shortCondition)
strategy.entry("Short",strategy.short)// /L'-,
// ,'-. /MM . . / L '-,
// . _,--dMMMM\ /MMM `.. / '-,
// : _,--, )MMMMMMMMM),. `QMM ,<> /_ '-,'
// ; ___,--. \MM( `-' )M//MM\ ` ,',.; .-'* ; .'
// | \MMMMMM) \MM\ ,dM//MMM/ ___ < ,; `. )`--' /
// | \MM()M MMM)__ /MM(/MP' ___, \ \ ` `. `. /__, ,'
// | MMMM/ MMMMMM( /MMMMP'__, \ | / `. `-,_\ /
// | MM /MMM---' `--'_ \ |-' |/ `./ .\----.___
// | /MM' `--' __,- \"" |-' |_, `.__) . .F. )-.
// | `--' \ \ |-' |_, _,-/ J . . . J-'-. `-.,
// | __ \`. | | | \ / _ |. . . . \ `-. F
// | ___ / \ | `| ' __ \ | /-' F . . . . \ '`
// | \ \ \ / | __ / \ | |,-' __,- J . . . . . \
// | | / |/ __,- \ ) \ / |_,- __,--' |. .__.----,'
// | |/ ___ \ |'. |/ __,--' `.-;;;;;;;;;\
// | ___ \ \ | | ` __,--' /;;;;;;;;;;;;.
// | \ \ |-'\ ' __,--' /;;;;;;;;;;;;;;\
// \ | | / | __,--' `--;;/ \;-'\
// \ | |/ __,--' / / \ \
// \ | __,--' / / \ \
// \|__,--' _,-;M-K, ,;-;\
// <;;;;;;;; '-;;;;
//a1=plot(n1,color=c)
//a2=plot(n2,color=c)
//plot(cross(n1, n2) ? n1 : na, style = circles, color=b, linewidth = 4)
//plot(cross(n1, n2) ? n1 : na, style = line, color=d, linewidth = 4)
//plot(conversionLine, color=#0496ff, title="Conversion Line")
//plot(baseLine, color=#991515, title="Base Line")
//plot(close, offset = -displacement, color=#459915, title="Lagging Span")
//p1=plot (leadLine1, offset = displacement, color=green, title="Lead 1")
//p2=plot (leadLine2, offset = displacement, color=red, title="Lead 2")
//fill(p1, p2, color = leadLine1 > leadLine2 ? green : red)
// remove the "//" from before the plot script if want to see the indicators on chart