개요
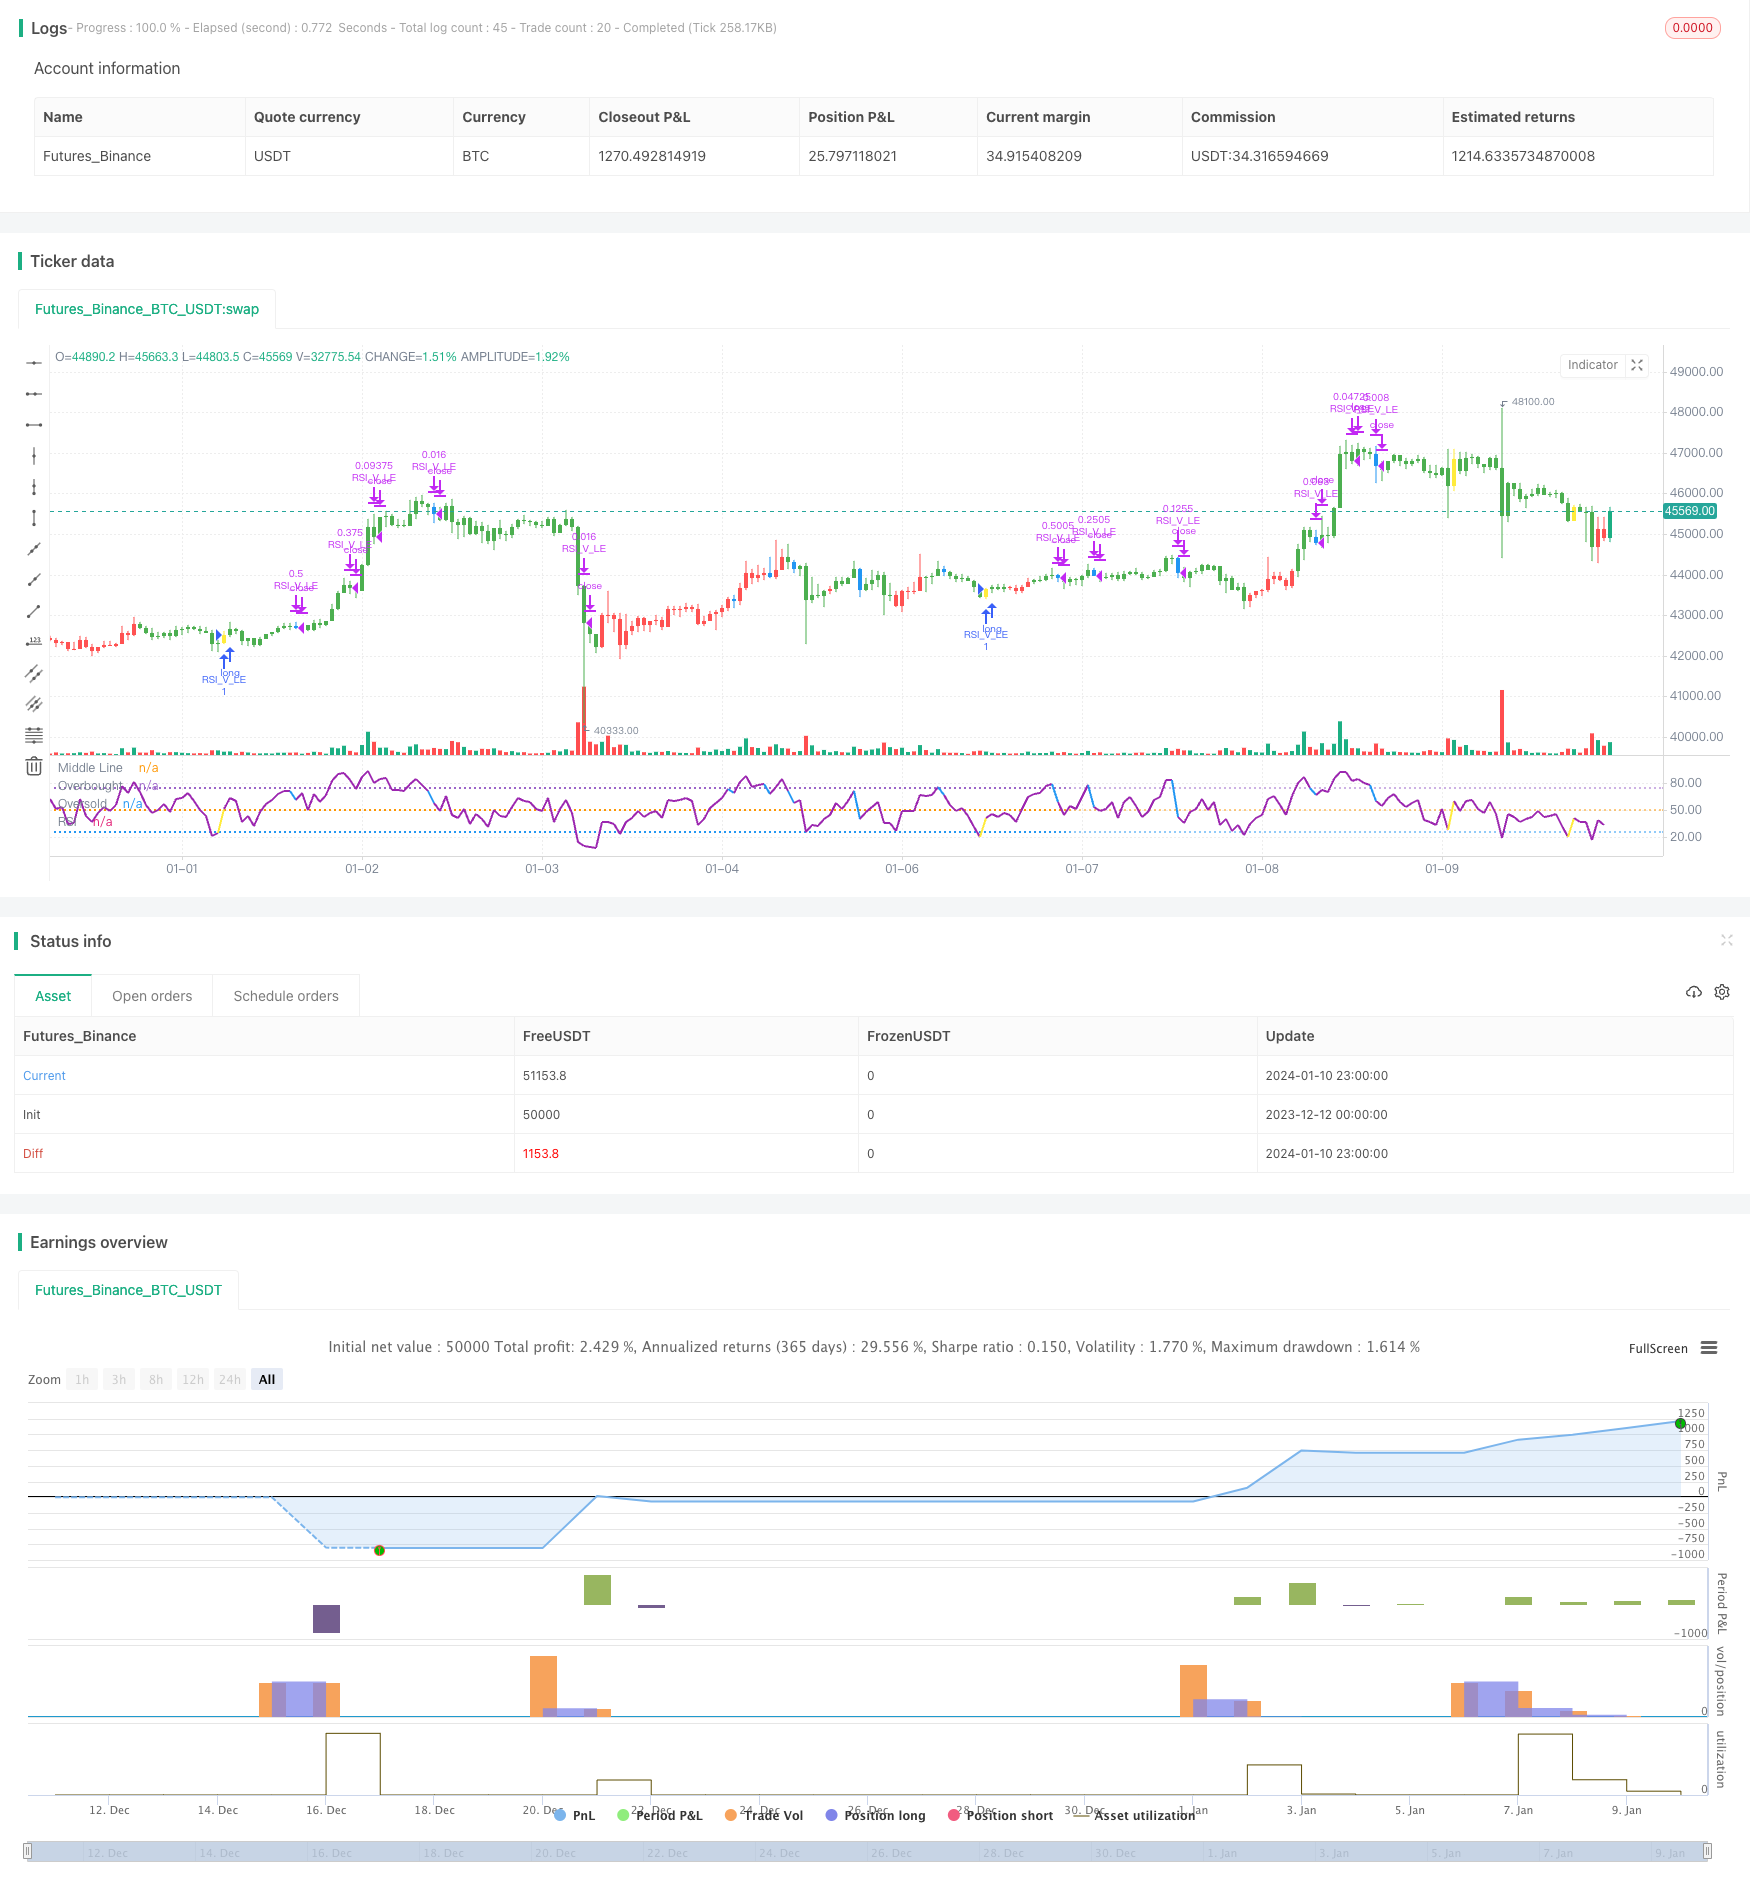
이 전략은 RSI 지표의 V 형태를 기반으로 EMA 평행선 필터링과 결합하여 신뢰할 수 있는 단선 이윤 전략을 형성한다. 이 전략은 오버셀드 영역에서 가격이 부진하는 기회를 포착하여 RSI 지표의 V 형태 신호를 통해 정확하게 더 많이 하고, 단선에서 이윤을 얻는 목적을 달성한다.
전략 원칙
- 20일선 위에 50일선으로 긴 선의 다중을 판단하는 방법
- RSI가 V형으로 형성되어 반출 기회를 초과하는 것을 의미합니다.
- K 선의 최저점은 K 선의 최저점보다 낮습니다.
- 현재 K선 RSI는 앞의 두 K선 RSI보다 높습니다.
- RSI는 30을 V 모양으로 표시하고, 더 많은 것을합니다.
- 입점 가격의 8% 이하로 설정
- RSI가 70을 넘어서 입시 가격으로 이동
- RSI가 90을 통과하기 시작하면
- RSI가 10을 넘어서 / 스톱 손실 트리거, 모두 평점
우위 분석
- EMA 평균선을 사용하여 큰 트렌드 방향을 판단하고 역동적인 조작을 피하십시오.
- RSI V 형태는 oversold 지역 반동 기회를 판단하여 역전 추세를 포착합니다.
- 다중 손해 방지 장치의 위험 제어
위험 분석
- 대시장 하락으로 인해 손실이 커질 수 있다.
- RSI V 형태 신호에 오류가 있을 수 있으며 불필요한 손실을 초래할 수 있습니다.
최적화 방향
- RSI 변수를 최적화하여 더 신뢰할 수 있는 RSI V 형태를 찾습니다.
- 다른 지표와 함께 역전 신호의 신뢰성을 판단
- 너무 급진적인 것을 막는 동시에 적시에 손실을 막는 전략을 최적화하십시오.
요약하다
이 전략은 EMA 평평선 필터링과 RSI V 형태 판단을 통합하여 더 신뢰할 수있는 단선 운영 전략을 형성합니다. 그것은 과매도 지역 반동의 기회를 효과적으로 포착하여 단선에서 수익을 창출 할 수 있습니다.
전략 소스 코드
/*backtest
start: 2023-12-12 00:00:00
end: 2024-01-11 00:00:00
period: 1h
basePeriod: 15m
exchanges: [{"eid":"Futures_Binance","currency":"BTC_USDT"}]
*/

// This source code is subject to the terms of the Mozilla Public License 2.0 at https://mozilla.org/MPL/2.0/
// © mohanee

//@version=4
//strategy("RSI V Pattern", overlay=true)
strategy(title="RSI V Pattern", overlay=false )

//Strategy Rules
//ema20 is above ema50  --- candles are colored  green on the chart
//RSI value sharply coming up which makes a V shape ,  colored in yellow on the chart
//RSI V pattern should occur from below 30

len = input(title="RSI Period", minval=1, defval=5)
stopLoss = input(title="Stop Loss %", minval=1, defval=8)

myRsi = rsi(close,len)

longEmaVal=ema(close,50)
shortEmaVal=ema(close,20)

//plot emas
//plot(longEmaVal, title="Long EMA" ,linewidth=2, color=color.orange, trackprice=true)
//plot(shortEmaVal, title="Short EMA" ,linewidth=2, color=color.green, trackprice=true)


longCondition =  ema(close,20)>ema(close,50)   and (low[1]<low[2] and  low[1]<low[3]) and (myRsi>myRsi[1] and myRsi>myRsi[2] ) and crossover(myRsi,30) //  (   and myRsi<60)

//(myRsi<60 and myRsi>30)  and myRsi>myRsi[1] and (myRsi[1]<myRsi[2]  or  myRsi[1]<myRsi[3]) and (myRsi[2]<30)  and (myRsi[3]<30 and myRsi[4]>=30)


barcolor(shortEmaVal>longEmaVal?color.green:color.red)
//longCondition = crossover(sma(close, 14), sma(close, 28))
barcolor(longCondition?color.yellow:na)
strategy.entry("RSI_V_LE", strategy.long, when=longCondition )
//stoploss value at 10%
stopLossValue=strategy.position_avg_price -  (strategy.position_avg_price*stopLoss/100)
//stopLossValue=valuewhen(longCondition,low,3)


//takeprofit at RSI highest  reading
//at RSI75 move the stopLoss to entry price
moveStopLossUp=strategy.position_size>0 and crossunder(myRsi,70)
barcolor(moveStopLossUp?color.blue:na)
stopLossValue:=crossover(myRsi,70) ? strategy.position_avg_price:stopLossValue

//stopLossValue:=moveStopLossUp?strategy.position_avg_price:stopLossValue
rsiPlotColor=longCondition ?color.yellow:color.purple
rsiPlotColor:= moveStopLossUp ?color.blue:rsiPlotColor
plot(myRsi, title="RSI", linewidth=2, color=rsiPlotColor)
//longCondition?color.yellow:#8D1699)
hline(50, title="Middle Line", linestyle=hline.style_dotted)
obLevel = hline(75, title="Overbought", linestyle=hline.style_dotted)
osLevel = hline(25, title="Oversold", linestyle=hline.style_dotted)
fill(obLevel, osLevel, title="Background", color=#9915FF, transp=90)


//when RSI crossing down 70 , close 1/2 position and move stop loss to average entry price
strategy.close("RSI_V_LE",  qty=strategy.position_size*1/2, when=strategy.position_size>0 and crossunder(myRsi,70))

//when RSI reaches high reading 90 and crossing down close 3/4 position
strategy.close("RSI_V_LE",  qty=strategy.position_size*3/4, when=strategy.position_size>0 and crossunder(myRsi,90))


//close everything when Rsi goes down below to 10 or stoploss hit
//just keeping RSI cross below 10 , can work as stop loss , which also keeps you long in the trade ... however sharp declines could  make large loss
//so I combine RSI goes below 10 OR stoploss hit  , whichever comes first - whole posiition closed
longCloseCondition=crossunder(myRsi,10)  or close<stopLossValue
strategy.close("RSI_V_LE", qty=strategy.position_size,when=longCloseCondition )