더블 이동 평균 골든 크로스 전략

개요
이중 이동 평균 선의 골드 크로스 전략은 이동 평균을 기반으로 한 양적 거래 전략이다. 이 전략은 다른 주기의 이동 평균을 계산하여 시장의 추세와 매매 시기를 판단한다. 단기 이동 평균 위에 장기 이동 평균을 가로지르면, 구매 신호로 골드 크로스를 생성하고, 단기 이동 평균 아래에 장기 이동 평균을 가로지르면, 판매 신호로 데드 크로스를 생성한다.
전략 원칙
이중 이동 평균 골드 크로스 전략의 핵심 논리는 이동 평균의 평평한 특성에 기반한다. 이동 평균은 시장 소음을 효과적으로 필터링하여 대략적인 추세 방향을 나타냅니다. 단기 이동 평균은 가격 변화에 더 민감하며 최근 기간 동안의 가격 변동 정보를 포착 할 수 있습니다.
이중 이동평균선 전략의 또 다른 핵심은 RSI 지표이다. RSI는 시장이 과매매 상태인지 여부를 효과적으로 판단할 수 있다. RSI와 결합하면 시장 전환점 근처에서 잘못된 거래가 발생하는 것을 피할 수 있다. 이 전략은 RSI 지표가 조건을 충족하는 경우에만 구매 및 판매 신호를 생성한다.
특히, 이 전략의 거래 결정 논리는 다음과 같습니다.
- 20주기, 50주기, 100주기 이동 평균을 계산합니다.
- 20 주기의 이동 평균이 50 주기의 이동 평균과 100 주기의 이동 평균을 통과하는지 여부를 판단하고, 만족하면 추세 상승 단계에 들어갈 수 있습니다.
- 동시에 RSI 지표가 50 미만인 경우를 검사하여 과매매 영역에 진입하지 않았음을 나타냅니다.
- 위의 세 가지 조건이 동시에 충족되면 구매 신호가 생성됩니다.
- 20주기 이동 평균이 50주기 및 100주기 이동 평균을 통과하는지 여부를 판단하고, 만족하면 추세 하향 단계에 들어갈 수 있습니다.
- 동시에 RSI 지수가 48.5 이상인 경우를 검증하여 초과 판매 영역에 진입하지 않았음을 나타냅니다.
- 위의 세 가지 조건이 동시에 충족되면 판매 신호가 생성됩니다.
이 전략은 여러 매개 변수의 조합을 통해 가짜 신호를 효과적으로 필터링하여 거래 의사 결정의 정확성을 향상시킬 수 있습니다.
전략적 이점
이중 이동평균선 골드 크로스 전략은 다음과 같은 장점이 있다:
- 전략은 간단하고 명확하며 이해하기 쉽고 실행이 가능합니다.
- 매개 변수 최적화 유연성, 이동 평균의 주기를 조정하여 다른 시장에 적합하게 조정할 수 있습니다.
- 이동 평균과 RSI 지표의 조합을 사용하여 시장을 실제 추세로 평가하여 잡음을 효과적으로 필터링 할 수 있습니다
- 역추적 자료에 따르면 이 전략은 안정적인 수익을 거두며 소규모의 인출을 기록했다.
- 기계 학습과 같은 첨단 기술을 통합하여 정책 매개 변수를 더 최적화 할 수 있습니다.
전략적 위험
이중 이동평균선 골드 크로스 전략에는 다음과 같은 위험도 있습니다.
- 시장이 급격하게 변동할 때 이동 평균은 지연되어 가장 좋은 매매 지점을 놓칠 수 있습니다.
- 전략은 변수 의존 최적화, 변수가 잘못 설정되면 전략 수익에 큰 영향을 미칠 수
- 장기 운영 시 시장 구조가 변할 수 있으며 이동 평균과 RSI 파라미터가 조정되어야 합니다.
- 자동화 거래 전략은 포지션을 집중적으로 유지하기 쉽고 시장이 변할 때 위험이 더 크다.
위험성을 줄이기 위해 다음과 같은 측면에서 최적화할 수 있습니다.
- 변동률 지표와 같은 시장 변동의 빈도와 크기를 평가하고, 이동 평균 주기를 동적으로 조정합니다.
- 매개 변수를 동적으로 최적화하는 기계 학습 모델을 추가합니다.
- 단독 손실을 방지하기 위해 Stop Loss을 설정합니다.
- 포지션 관리 시스템을 적용하여 시장 상황에 따라 포지션 크기를 조정하여 포지션 집중 위험을 줄이십시오.
전략 최적화 방향
이 두 개의 이동평등선 골드 크로스 전략에는 더 많은 최적화가 가능합니다:
- 거래량, 브린 밴드 등과 같은 다른 지표 필터 신호를 추가하여 전략 안정성을 향상시킵니다.
- 기계 학습을 사용하여 역동적으로 최적화 된 변수를 사용하여 전략을 더 지능화합니다.
- 시장 구조 변화에 따라 변수를 조정하는 이동 평균 주기 설정을 설계
- 고급 리스크 관리 시스템과 결합하여 전략적 위험을 줄이기 위해 포지션을 동적으로 조정합니다.
- 알고리즘 거래 포트폴리오를 구축하여 다양한 거래 전략을 통합하여 안정성을 높여줍니다.
요약하다
이중 이동평균선 골드크로스 전략은 매우 고전적인 규칙형의 양적 거래 전략이다. 그것은 간단하고 구현하기 쉽으며, 매개 변수를 최적화하는 것은 유연하며, 수익 성과도 우수하며, 초보자 입문 양적 거래에 좋은 선택이다. 그러나 이 전략에는 또한 제한이 있으며, 추가 연구 및 최적화를 통해 더 높은 지능화 및 안정성으로 나아갈 수 있으며, 실제로 지속적으로 수익을 창출할 수 있다.
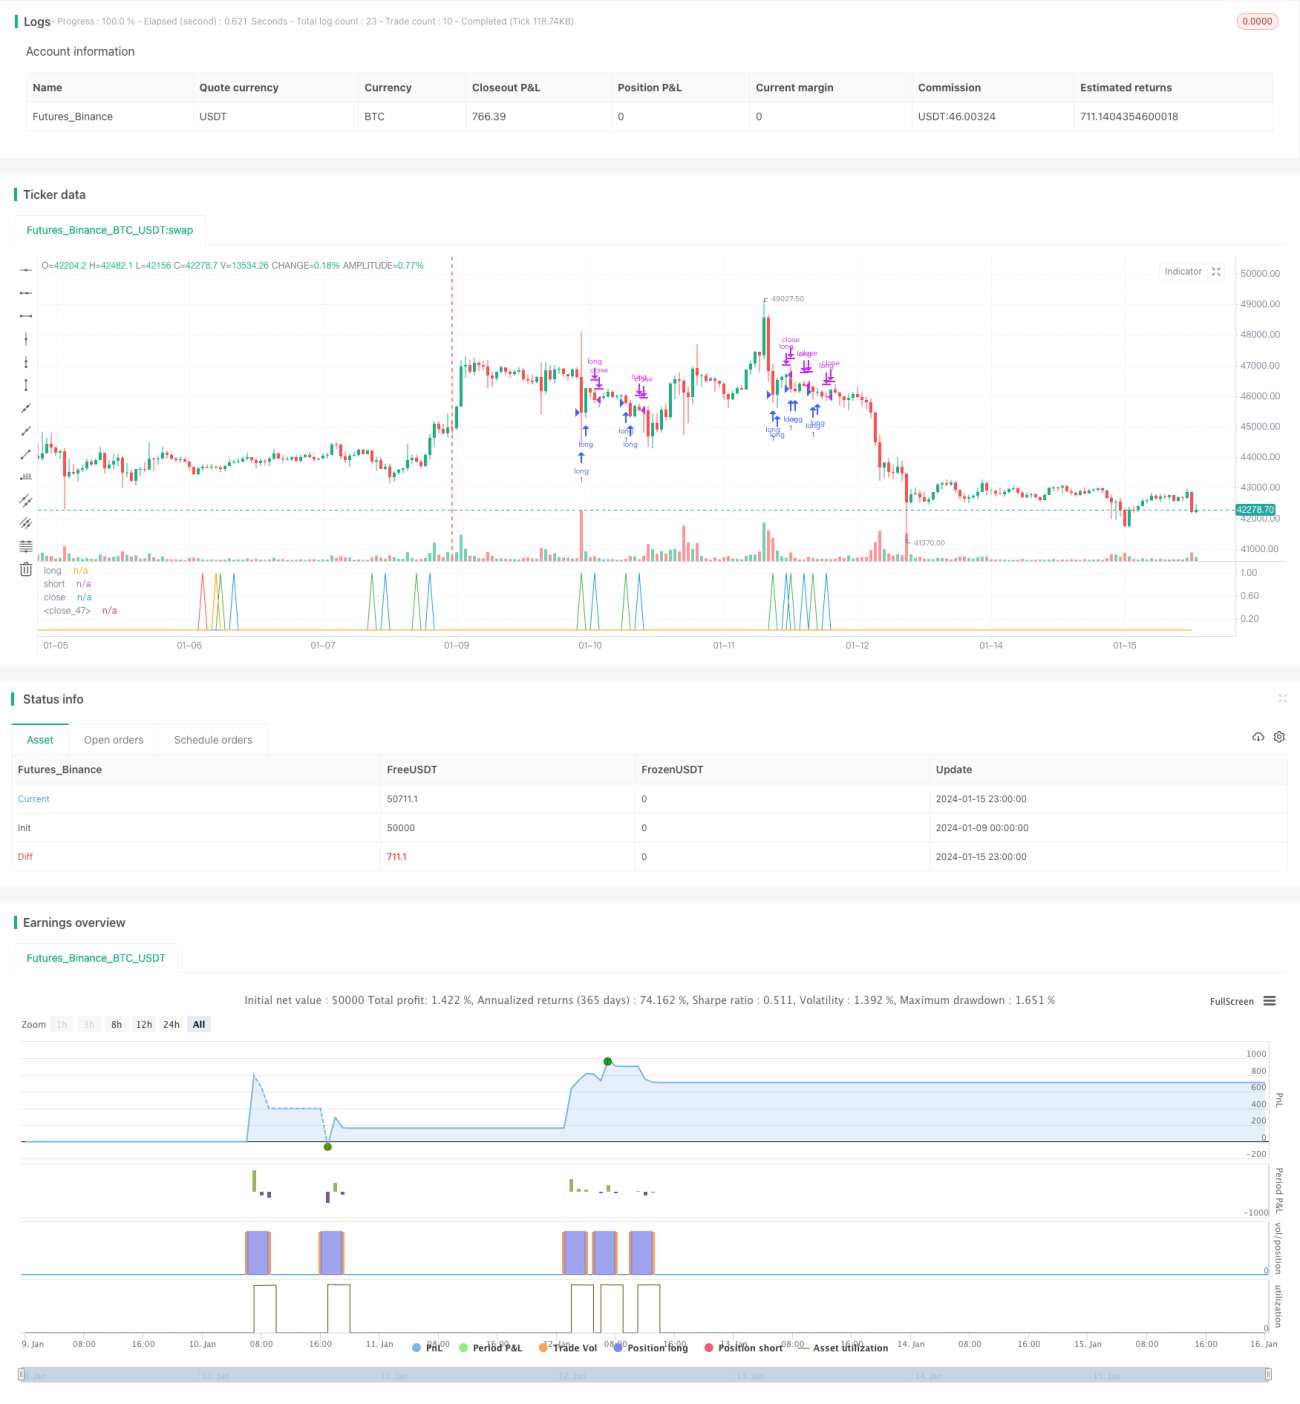
/*backtest
start: 2024-01-09 00:00:00
end: 2024-01-16 00:00:00
period: 1h
basePeriod: 15m
exchanges: [{"eid":"Futures_Binance","currency":"BTC_USDT"}]
*/

//@version=4
//Based on Larry Connors RSI-2 Strategy - Lower RSI
strategy(title="EA_3Minute_MagnetStrat", shorttitle="EA_3Minute_MagnetStrat", overlay=false)
src = close, - 1