모멘텀 포지셔널 노로밴드 전략

1
Follow
1788
Followers
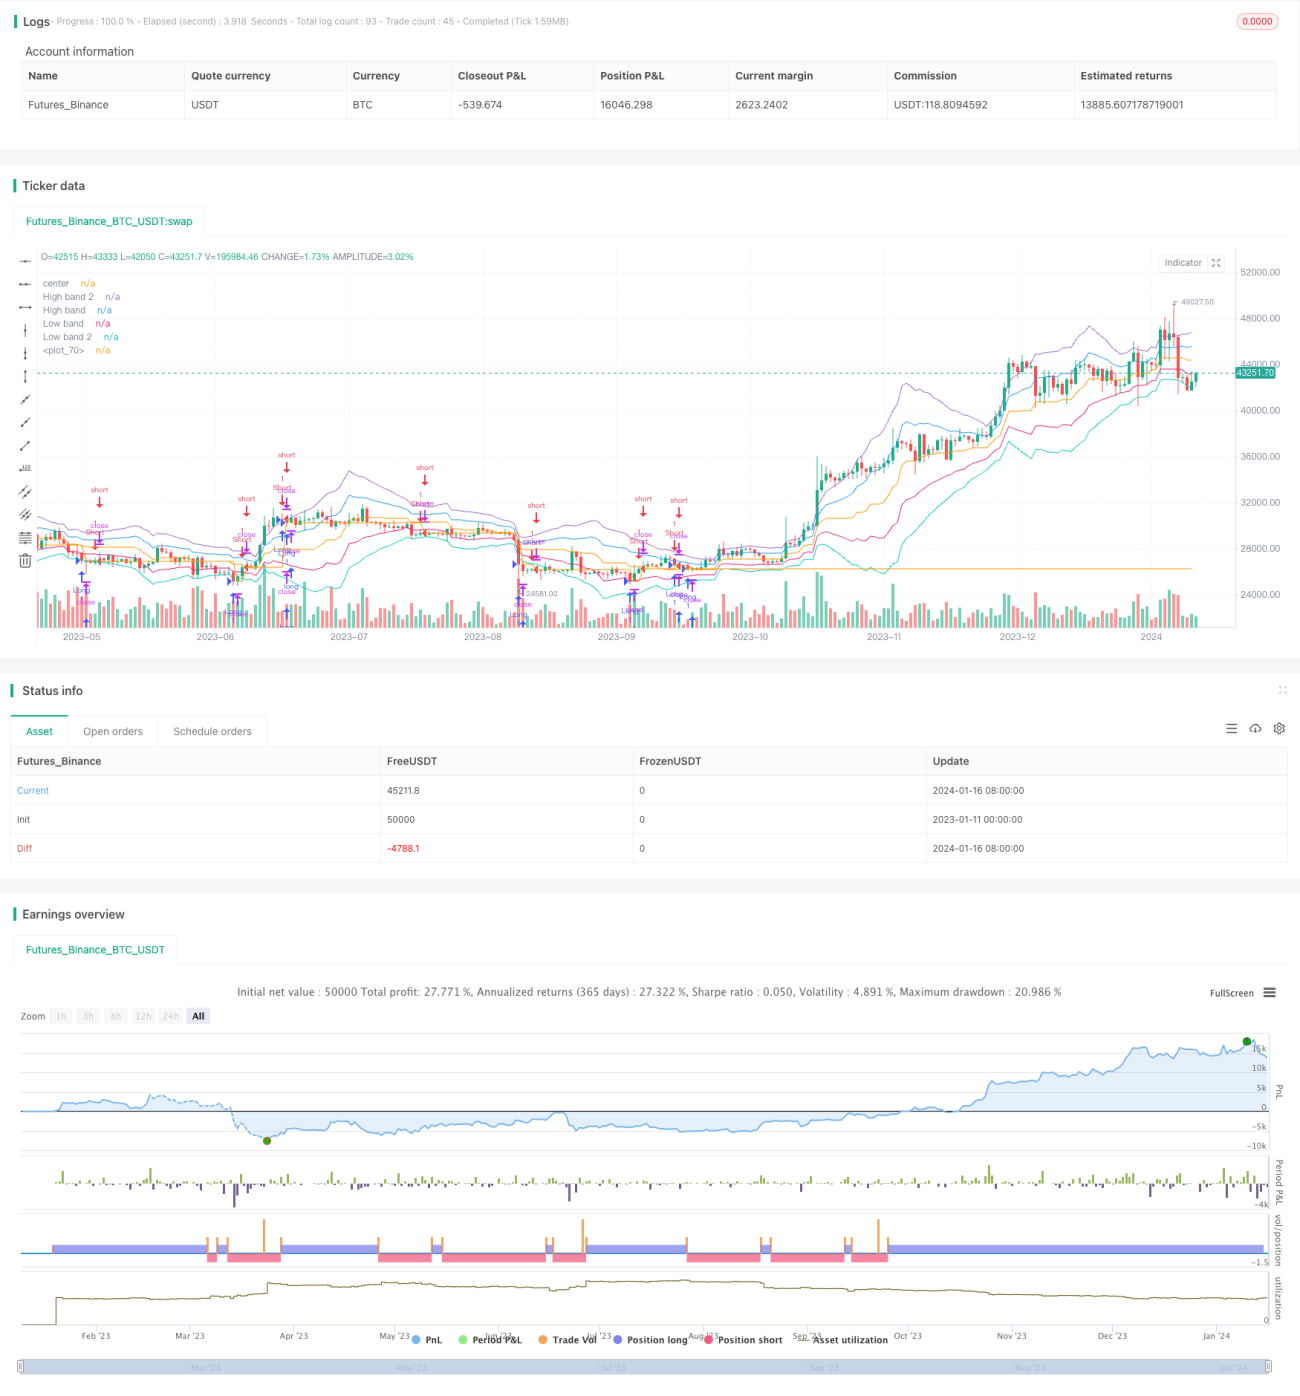
개요
이 전략은 노로 (Noro) 의 파동 이론과 양적 기술을 결합한 동적 뚫림 전략이다. 그것은 평균선, RSI, 파동, 그리고 호랑이색과 같은 여러 지표들을 계산하여 매매 신호를 형성하고 파동 뚫림 거래를 구현한다.
전략 원칙
- 평균 실제 파장을 통해 파장의 상하를 계산한다. 가격의 상하 돌파는 호불호 신호이며, 하하 돌파는 하향 신호이다.
- RSI 지표로 판단하면, RSI는 30이하의 부진과 70이하의 부진을 나타냅니다.
- 최고 가격과 최저 가격의 돌파구를 통해 가격의 동적 방향을 판단한다.
- 황소와 곰의 색깔을 통해 다수점과 공시장을 판단한다. 초록색은 다수점 시장, 낙점; 빨간색은 공시 시장, 낙점 <unk>.
- 평행선 판단의 이탈과 결합하여 거래 신호를 발산한다.
우위 분석
- 다양한 지표 조합으로 정확도를 높여줍니다.
- 이 전략은 Band Theory와 Quantitative Technology의 결합으로 더욱 효과적입니다.
- 동력 돌파는 반전 거래와 결합하여 수익 공간을 강화합니다.
- 확장성이 강하며 시장에 따라 변수를 조정할 수 있다.
위험 분석
- 매개 변수 설정은 지속적으로 최적화 및 테스트가 필요합니다.
- 다중공간 전환시 적시에 대응하지 못하여 손실이 발생할 수 있습니다.
- 트랜잭션이 많고, 트랜잭션 수수료와 슬라이드 포인트에 영향을 많이 받는다.
- 다른 주기에 맞추기 위해 적시에 파장 매개 변수를 조정해야 한다.
최적화 방향
- 다중 시간 주기 검증, 최적의 변수 조합을 찾습니다.
- 단독 손실을 줄이기 위해 손해 방지 전략을 늘리십시오.
- 포지션 관리를 강화하고 수익성을 높여라.
- 딥러닝과 결합하여 파라미터를 자동으로 최적화한다.
요약하다
이 전략은 여러 가지 전형적인 정량 기술 지표를 종합적으로 사용하여 운동 지표와 역전 지표의 결합을 통해 효율적인 수익을 달성한다. 또한 평균 실제 파장 이론을 사용하여 합리적인 진입 지점을 찾는다. 기술 지표와 이론의 결합의 전형이라고 할 수 있다. 매개 변수 최적화 및 위험 제어의 지속적인 개선을 통해 효율적인 안정화 전략이 될 것이다.
Source
Pine
Strategy parameters
Related strategies
Comment
All comments (0)
No data
- 1