개요
이 전략은 빠른 이동 평균과 느린 이동 평균을 사용하여 거래 신호를 구축하여 트렌드를 식별하고 추적합니다. 빠른 라인이 느린 라인을 통과하면 구매 신호가 발생하고 빠른 라인이 느린 라인을 통과하면 판매 신호가 발생합니다. 이 전략은 중장기 트렌드를 추적하는 데 적합하며 시장 소음을 효과적으로 필터링 할 수 있습니다.
전략 원칙
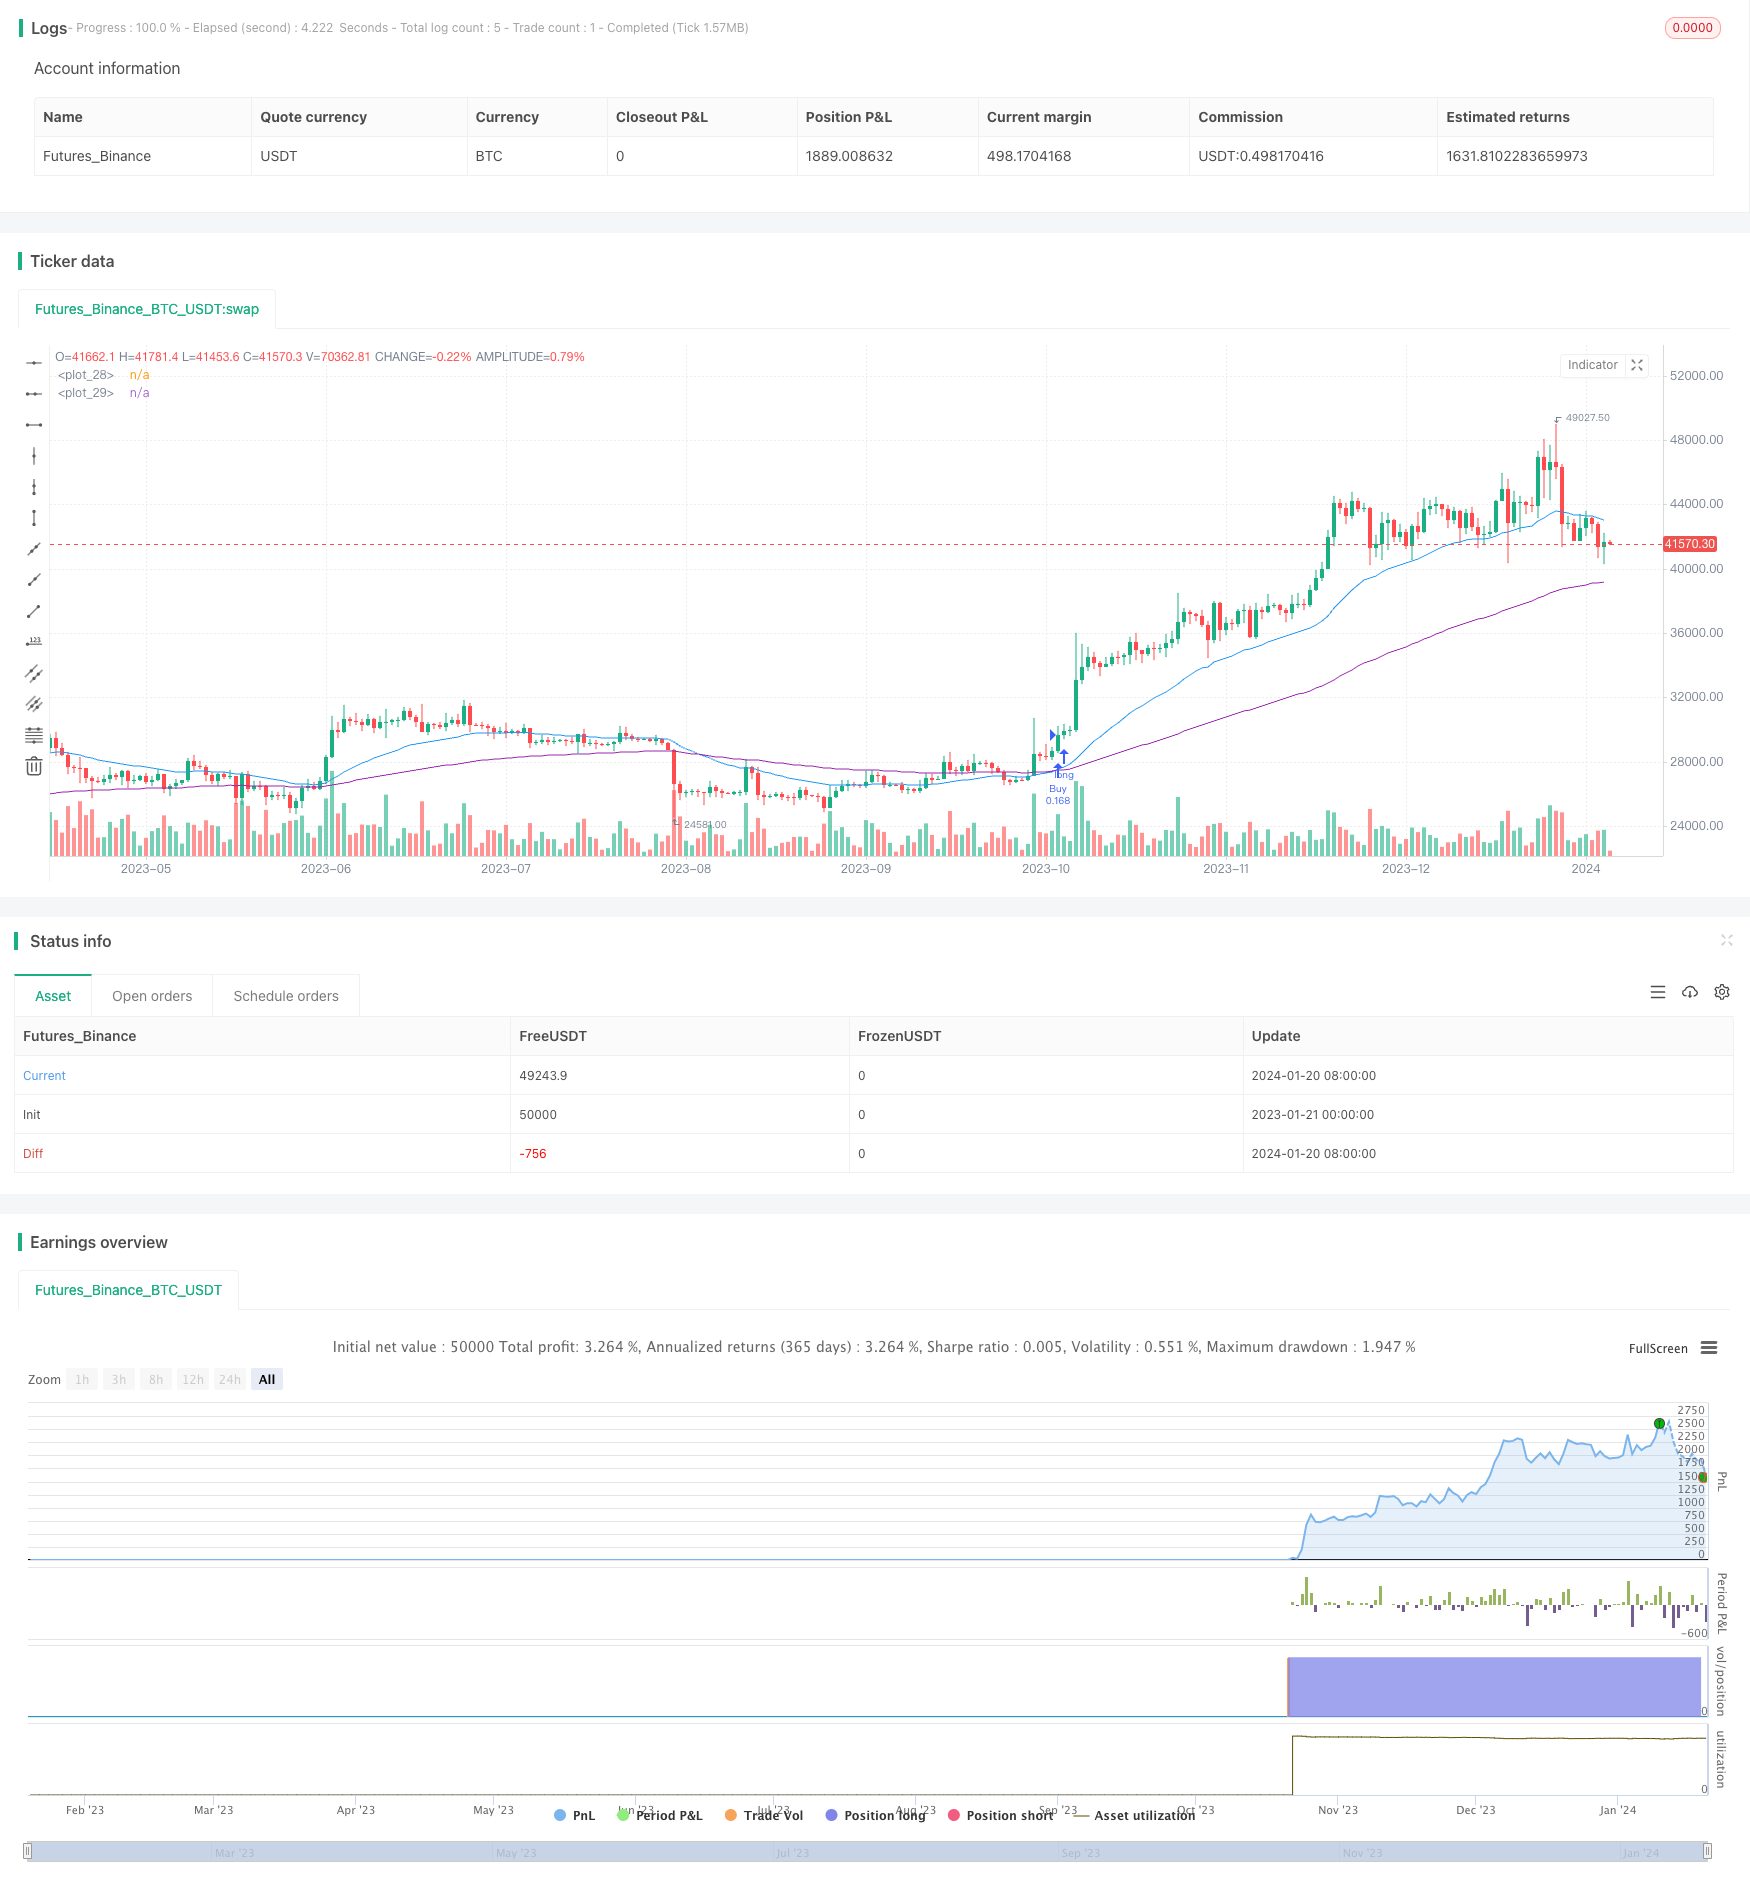
이 전략은 거래 결정의 기초로 두 개의 다른 기간의 Exponential Moving Average를 사용한다. 빠른 이동 평균 파라미터는 30일로 설정되어 있으며, 이는 비교적 짧은 가격 변화를 포착하기 위해 사용된다. 느린 이동 평균 파라미터는 100일로 설정되어 있으며, 이는 가격의 중장기 경향을 판단하기 위해 사용된다.
빠른 선이 아래에서 느린 선을 통과하면, 시장이 상승 추세로 들어서 구매 신호를 생성하는 것을 나타냅니다. 빠른 선이 위에서 아래에서 느린 선을 통과하면, 시장이 하향 추세로 들어서 판매 신호를 생성하는 것을 나타냅니다.
전략적 이점
이 전략은 다음과 같은 장점을 가지고 있습니다.
- 평선형으로 구성되어 있어, 단기시장 소음을 효과적으로 제거할 수 있다.
- 이 두 개의 동선 전략은 트렌드 방향을 명확하게 판단할 수 있습니다.
- 매개 변수 최적화를 구현하기 위해, 속속평선주기를 사용자 정의할 수 있다.
- 중장기 트렌드 및 단기 조정 기능을 갖췄다.
- 규칙은 간단하고 명확하며, 이해하기 쉽고, 초보자도 배울 수 있습니다.
위험 분석
이 전략에는 몇 가지 위험도 있습니다.
- 가격이 수평으로 정리될 때, 잘못된 트레이딩 신호가 발생하기 쉽다. 평균선 변수를 최적화하여 위험을 줄일 수 있다.
- 가격의 급격한 변동에 대한 비정상적인 상황을 효과적으로 판단하고 처리 할 수 없습니다. 위험을 제어하기 위해 스톱을 설정할 수 있습니다.
- 평균선 시스템은 그 자체로 지연성이 있으며 가격 전환점을 놓칠 수 있다. 다른 지표와 함께 최적화할 수 있다.
최적화 방향
이 전략은 다음과 같은 부분에서 최적화될 수 있습니다.
- 평균선의 주기적 변수를 최적화하여 수익효율을 높인다.
- 거래량 지표와 같은 다른 조건 판단 지표를 추가하여 가짜 돌파구를 피하십시오.
- 단독 손실을 통제하기 위한 전략이 추가되었습니다.
- 트렌드 지표와 결합하여 트렌드 강도를 판단하고 트렌드 반전을 피하십시오.
- 추가된 변수 최적화 기능으로, 정책이 더 보편적으로 사용된다.
요약하다
이 전략은 쌍평평선 구축 거래 의사결정 시스템을 기반으로, 빠른 평평선과 느린 평평선의 가격 관계를 통해 시장 추세를 판단하고, 신호를 생성하는 것이 간단하고 명확하다. 이 전략은 일부 잡음을 필터링하여, 중장선 추세 거래에 적합합니다. 그러나 여러 지표 최적화 및 위험 제어를 통해이 전략을 더 보편적이고 효율적으로 최적화 할 수 있습니다.
/*backtest
start: 2023-01-21 00:00:00
end: 2024-01-21 00:00:00
period: 1d
basePeriod: 1h
exchanges: [{"eid":"Futures_Binance","currency":"BTC_USDT"}]
*/

//@version=2
strategy("EMA Strategy v2", shorttitle = "EMA Strategy v2", overlay=true, pyramiding = 3,default_qty_type = strategy.percent_of_equity, default_qty_value = 10)


// === Inputs ===
// short ma
maFastSource   = input(defval = close, title = "Fast MA Source")
maFastLength   = input(defval = 30, title = "Fast MA Period", minval = 1)

// long ma
maSlowSource   = input(defval = close, title = "Slow MA Source")
maSlowLength   = input(defval = 100, title = "Slow MA Period", minval = 1)

// invert trade direction
tradeInvert = input(defval = false, title = "Invert Trade Direction?")
// risk management
useStop     = input(defval = true, title = "Use Initial Stop Loss?")
slPoints    = input(defval = 0, title = "Initial Stop Loss Points", minval = 1)
useTS       = input(defval = true, title = "Use Trailing Stop?")
tslPoints   = input(defval = 0, title = "Trail Points", minval = 1)
useTSO      = input(defval = false, title = "Use Offset For Trailing Stop?")
tslOffset   = input(defval = 0, title = "Trail Offset Points", minval = 1)

// === Vars and Series ===
fastMA = ema(maFastSource, maFastLength)
slowMA = ema(maSlowSource, maSlowLength)

plot(fastMA, color=blue)
plot(slowMA, color=purple)

goLong() => crossover(fastMA, slowMA)
killLong() => crossunder(fastMA, slowMA)
strategy.entry("Buy", strategy.long, when = goLong())
strategy.close("Buy", when = killLong())

// Shorting if using
goShort() => crossunder (fastMA, slowMA)
killShort() => crossover(fastMA, slowMA)
//strategy.entry("Sell", strategy.short, when = goShort())
//strategy.close("Sell", when = killShort())

if (useStop)
    strategy.exit("XLS", from_entry ="Buy", stop = strategy.position_avg_price / 1.08 )
    strategy.exit("XSS", from_entry ="Sell", stop = strategy.position_avg_price * 1.58)