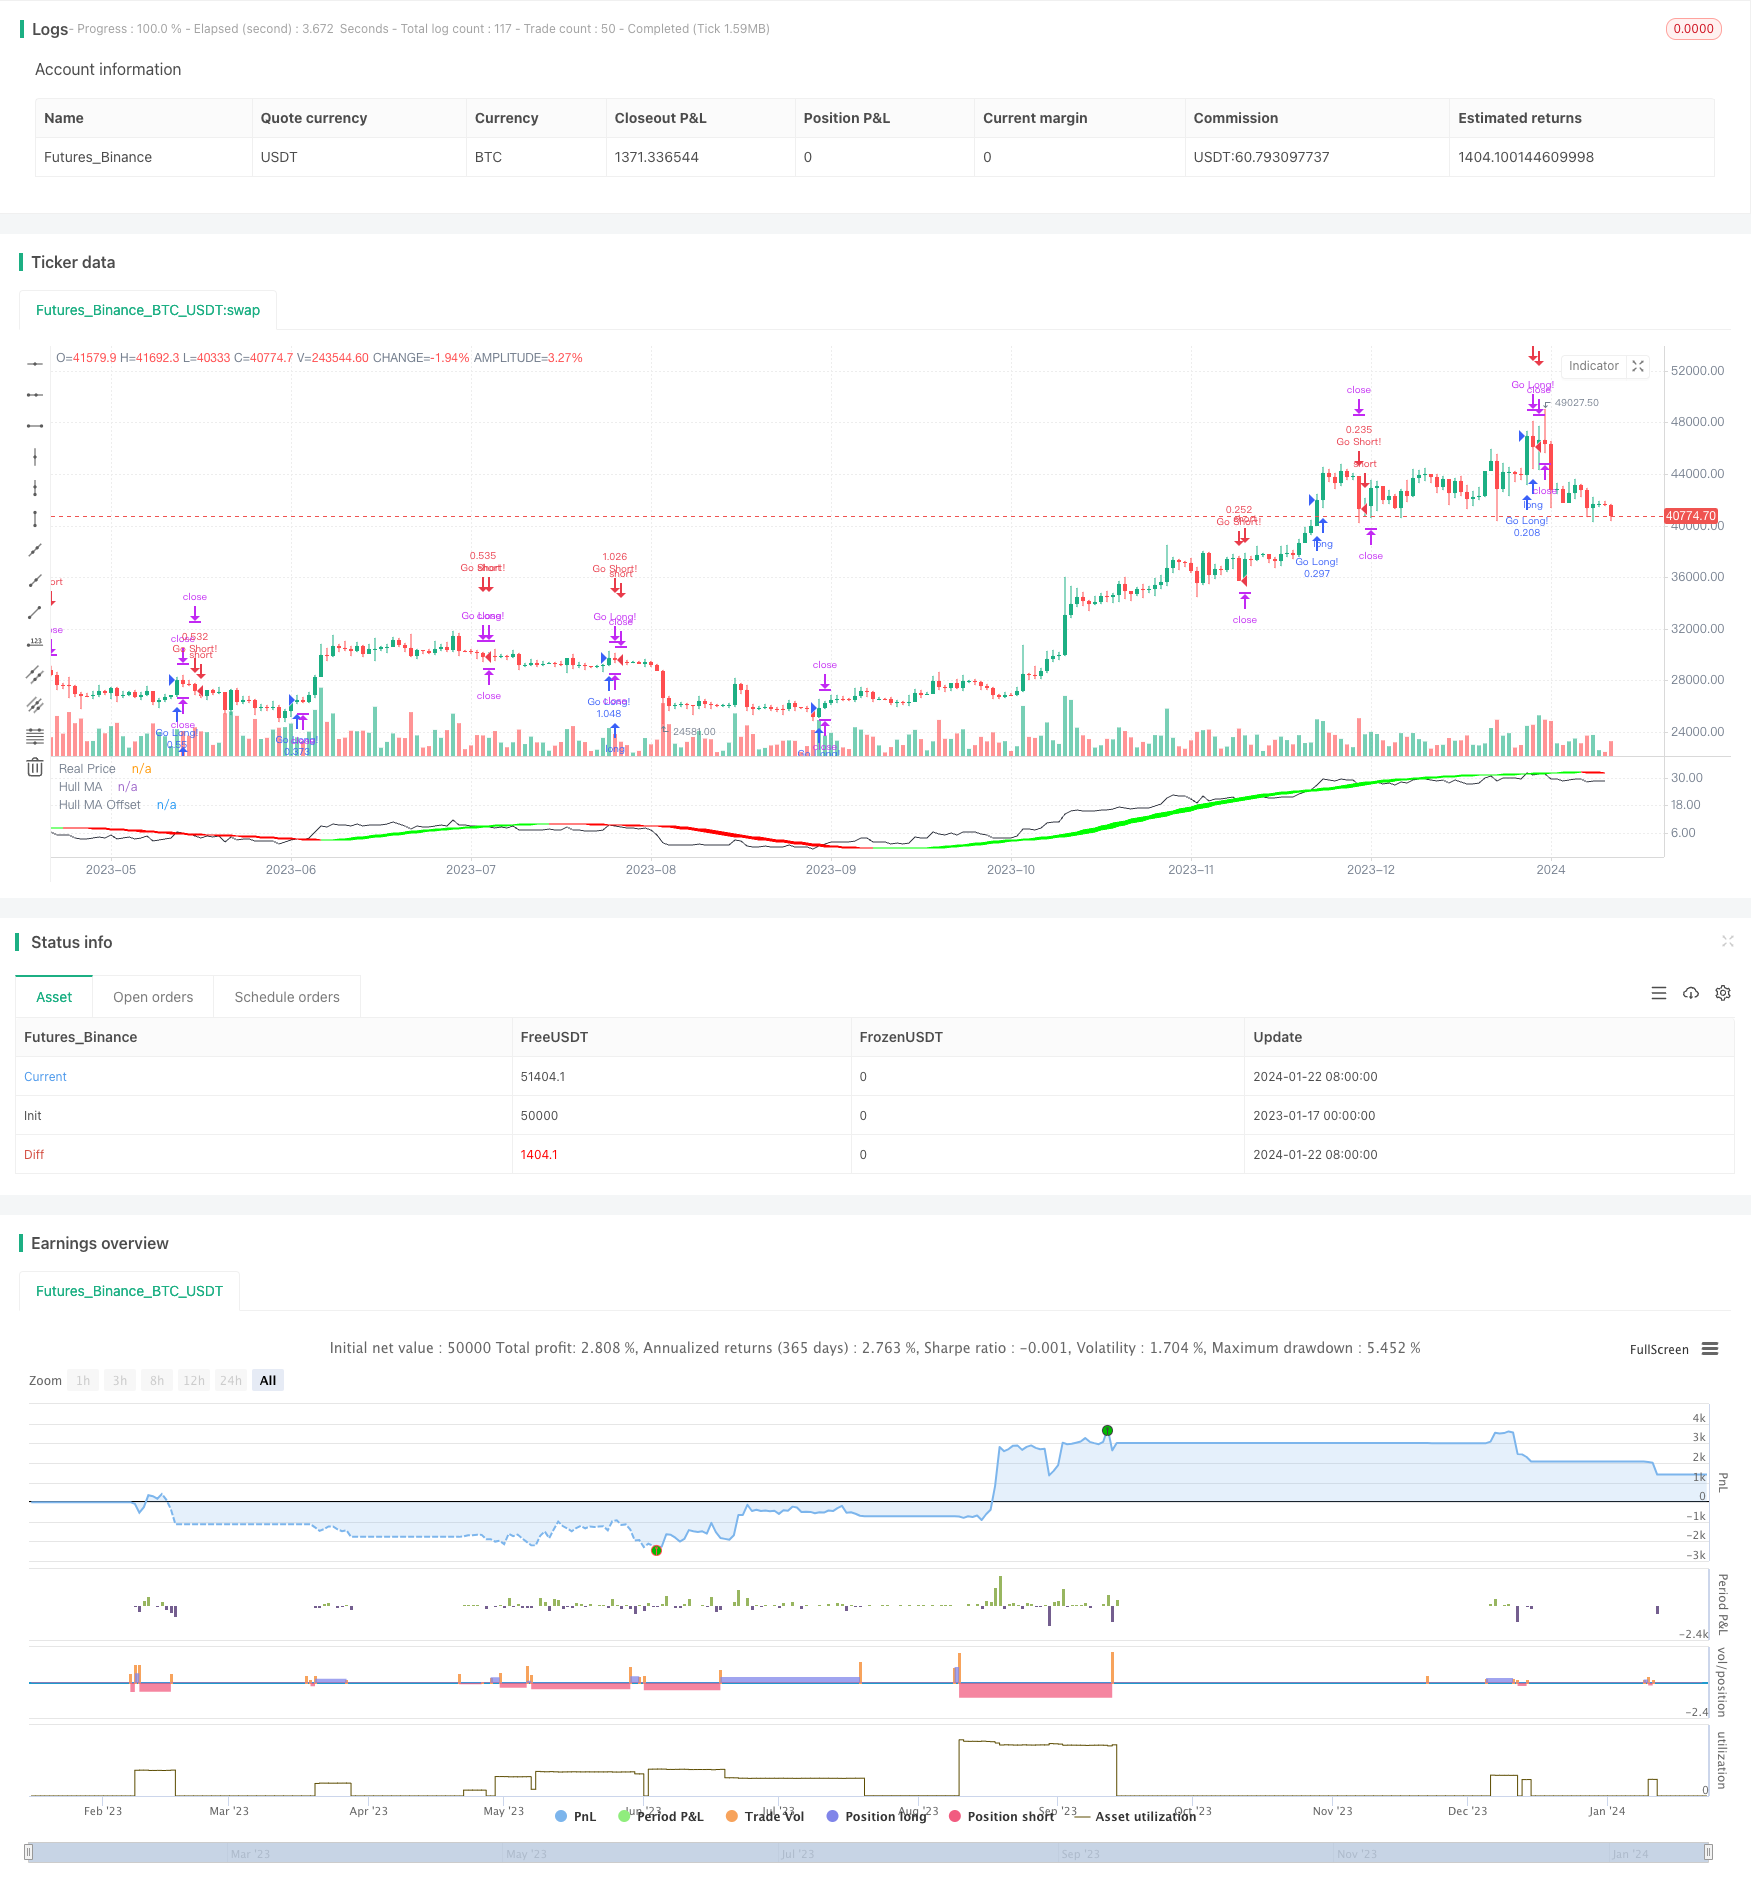
개요
이 독특한 규칙화된 체계화된 거래 전략은 트렌드를 따르는 범주에 속한다. 그것은 가격의 통일된 가격 순서를 사용하여 거래 신호를 생성한다. 주식 가격을 직접 사용하지 않는다. 이 전략은 고급 포지션 조정 및 위험 관리 기술을 채택한다.
전략 원칙
통일화 가격 은 전체 가격 시퀀스에 따라 계산된 변동율 조정된 가격의 누적일수익률이다. 변동율 조정 창 기간은 사용자에 의해 정의된다. 통일화 가격을 기반으로 헐 이동 평균을 계산하고, 주요 트렌드 판단 지표로 사용한다. 헐 이동 평균 창 기간은 사용자에 의해 정의되며, 100일이 기본으로 설정되어 트렌드 판단의 민감성을 보장하고, 너무 자주 거래되는 것을 피한다.
거래 전략의 핵심은 매우 간단하며, 상식화 가격이 헐 이동 평균을 상향으로 넘어서 더 많이 하고, 하향으로 넘어서 공백을 한다. 새로운 거래 신호는 적극적으로 오래된 역전 포지션을 평행한다.
포지션 규모는 최근 가격 변동율과 사용자 정의 연간 위험 목표에 기초한다. 포지션 크기는 실질적으로 변동율에 따라 조정된다. 낮은 변동율이 있을 때 포지션 크기가 커지고 높은 변동율이 있을 때 포지션 크기가 작다. 최근 변동율은 14일 가격 대칭 수익률 표준 차로 1년 동안의 예상 변동율에 추가된다. 이후 사용자 설정 연간 위험 목표에 따라 포지션을 조정한다.
스톱로즈는 최근 가격 평균 실제 변동의 폭에 따라 배수된 값으로 설정되어 있습니다.
전략적 이점
- 가짜 신호의 가능성을 줄이기 위해 가격 동질화 처리를 사용
- 포지션 동적 조정, 효과적인 위험 제어
- 실시간 상쇄는 더 큰 손실을 방지합니다.
- 거래 전략은 간단하고 직관적이며 이해하기 쉽습니다.
전략적 위험
- 헐 이동 평균은 주요 지표로서 다소 뒤쳐져 있습니다.
- 변동률을 이용한 포지션 조정으로 리스크를 제어하면서 수익 공간을 제한할 수 있습니다.
- 너무 가까이 접근하면 손실이 발생할 수 있습니다.
리스크 제어 조치에는 다양한 이동 평균 조합을 이용하고, 포지션 리스크 목표를 조정하는 등이 포함된다.
전략 최적화
- 다른 유형의 이동 평균 지표의 효과를 테스트합니다.
- 이동 평균 변수를 최적화합니다.
- 더 많은 일을 하거나 아무것도 하지 않는 것.
- 스톱 손실을 조정하여 최적의 지점을 찾습니다.
- 다른 손실을 방지하는 방법을 테스트합니다.
요약하다
이 전략은 여러 가지 기술 제어 위험을 통합합니다. 예를 들어, 가격의 통일화, 동적 조정, 중지 등이 있습니다. 간단한 추세를 따르는 원칙을 사용하여 거래합니다. 시장 및 개인 상황에 따라 파라미터를 조정하고 최적화 할 수 있습니다. 추가 테스트 검증에 가치가 있으며 실제 응용 잠재력이 있습니다.
/*backtest
start: 2023-01-17 00:00:00
end: 2024-01-23 00:00:00
period: 1d
basePeriod: 1h
exchanges: [{"eid":"Futures_Binance","currency":"BTC_USDT"}]
*/

// This source code is subject to the terms of the Mozilla Public License 2.0 at https://mozilla.org/MPL/2.0/
// © Crunchster1

//@version=5
strategy(title="Crunchster's Normalised Trend Strategy", shorttitle="Normalised Trend Strategy", overlay=false )

// Inputs and Parameters
src = input(close, 'Source', group='Strategy Settings')
length = input.int(title="Lookback period for price normalisation filter", defval=14, minval=2, group='Strategy Settings', tooltip='This sets the lookback period for the volatility adjustment of returns, which is used to transform the price series into the "real price"')
hlength = input.int(title="Lookback period for Hull Moving Average", defval=100, minval=2, group='Strategy Settings')
offset = input.int(title="HMA Offset", defval=0, minval=0, group='Strategy Settings')
long = input(true, 'Long', inline='08', group='Strategy Settings')
short = input(true, 'Short', inline='08', group='Strategy Settings', tooltip='Toggle long/short strategy on/off')

stopMultiple = input.float(1, 'Stop multiple', step=0.25, group='Risk Management Settings', tooltip='Multiple for ATR, setting hard stop loss from entry price')
lev = input.float(1, 'Max Leverage', step=0.5, group='Risk Management Settings', tooltip='Max leverage sets maximum allowable leverage of total capital (initial capital + any net profit), capping maximum volatility adjusted position size')
riskT = input.float(10, maxval=75, title='Annualised Volatility Target %', group='Risk Management Settings', tooltip='Specify annual risk target, used to determine volatility adjusted position size. Annualised daily volatility is referenced to this value and position size adjusted accordingly')
comp = input(false, 'Compounding', inline='09', group='Risk Management Settings')
Comppct = input.float(50, '%', step=5, inline='09', group='Risk Management Settings', tooltip='Toggle compounding of profit, and set % of profit to compound')

// Backtesting period
FromDay = input.int(defval=1, title='From Day', minval=1, maxval=31, inline='04', group='Backtest range')
FromMonth = input.int(defval=1, title='From Mon', minval=1, maxval=12, inline='04', group='Backtest range')
FromYear = input.int(defval=2018, title='From Yr', minval=1900, inline='04', group='Backtest range', tooltip='Set start of backtesting period')
ToDay = input.int(defval=1, title='To Day', minval=1, maxval=31, inline='05', group='Backtest range')
ToMonth = input.int(defval=1, title='To Mon', minval=1, maxval=12, inline='05', group='Backtest range')
ToYear = input.int(defval=9999, title='To Yr', minval=1900, inline='05', group='Backtest range', tooltip='Set end of backtesting period')

start = timestamp(FromYear, FromMonth, FromDay, 00, 00)
finish = timestamp(ToYear, ToMonth, ToDay, 23, 59)
window = true

// Normalised returns calculation
nRet = (src - src[1]) / ta.stdev((src - src[1]), length)

nPrice = ta.cum(nRet)

//Hull Moving Average - using normalised price series
fHMA = ta.wma(2 * ta.wma(nPrice[offset], hlength / 2) - ta.wma(nPrice[offset], hlength), math.round(math.sqrt(hlength)))

//Risk Management formulae
strategy.initial_capital = 50000
tr = math.max(high - low, math.abs(high - close), math.abs(low - close)) //True range
stopL = ta.sma(tr, 14) //Average true range
stdev = ta.stdev(close-close[1], 14) //volatility of recent returns
maxcapital = strategy.initial_capital+strategy.netprofit //Maximum capital available to invest - initial capital net of profit
annvol = 100*math.sqrt(365)*stdev/close //converts recent volatility of returns into annualised volatility of returns - assumes daily timeframe

risk = 1.1
if comp
    risk := (strategy.initial_capital+(Comppct*strategy.netprofit/100))//adjust investment capital to include compounding
else
    risk := strategy.initial_capital

shares = (risk * (riskT/annvol)) / close //calculates volatility adjusted position size, dependent on user specified annualised risk target
if ((shares*close) > lev*maxcapital) //ensures position size does not exceed available capital multiplied by user specified maximum leverage
    shares := lev*maxcapital/close

//To set the price at the entry point of trade
Posopen() =>
    math.abs(strategy.position_size[1]) <= 0 and math.abs(strategy.position_size) > 0

var float openN = na
if Posopen()
    openN := stopL

// Strategy Rules
if long
    longCondition = ta.crossover(nPrice, fHMA) and window
    exitlong = ta.crossunder(nPrice, fHMA)
    if (longCondition)
        strategy.entry('Go Long!', strategy.long, qty=shares)
    if strategy.position_size > 0
        strategy.exit('Stop Long', from_entry = 'Go Long!', stop=(strategy.opentrades.entry_price(0) - (openN * stopMultiple)))
    if (exitlong)
        strategy.close('Go Long!', immediately = true)

if short
    shortCondition = ta.crossunder(nPrice, fHMA) and window
    exitshort = ta.crossover(nPrice, fHMA)
    if (shortCondition)
        strategy.entry('Go Short!', strategy.short, qty=shares)
    if strategy.position_size < 0
        strategy.exit('Stop Short', from_entry = 'Go Short!', stop=(strategy.opentrades.entry_price(0) + (openN * stopMultiple)))
    if (exitshort)
        strategy.close('Go Short!', immediately = true)

// Visuals of trend and direction
plot(nPrice, title='Real Price', color=color.black)

MAColor = fHMA > fHMA[3] ? #00ff00 : #ff0000
MA1 = plot(fHMA, title='Hull MA', color=MAColor)
MA2 = plot(fHMA[3], title='Hull MA Offset', color=MAColor)
fill(MA1, MA2, title='Band Filler', color=MAColor)