개요
이 전략은 상대적 강도 지수 (RSI) 를 계산하여 시장의 잠재적 인 구매 및 판매 기회를 식별합니다. RSI 지표를 사용하여 가격이 추세에서 역행으로 전환 할 수있는 지점을 판단하여 역행 기회를 잡습니다. RSI가 오버 바이 또는 오버 셀 영역에서 역행 할 때 거래 신호가 발생합니다.
전략 원칙
이 전략의 핵심 지표는 RSI이며, 이는 종결 가격 상승의 날 수와 가격 하락의 날 수의 비율을 나타내는 것으로, 자산이 과대 평가되거나 과소 평가되는지 판단하는 데 사용됩니다. RSI는 0에서 100 사이의 수로 표시되며, 수치가 높으면 시장의 강도가 상승하고, 수치가 낮으면 시장의 강도가 하락합니다.
전략은 먼저 RSI의 파라미터를 설정하고, 주기 길이를 포함합니다 (기본 14), 오버셀 영역의 하락값 (기본 70 및 30). 그리고 RSI 값을 종결 가격에 따라 계산합니다. RSI 상위에서 오버셀 영역의 하락값을 통과하면 구매 신호를 생성하고, RSI 아래에서 오버셀 영역의 하락값을 통과하면 판매 신호를 생성합니다.
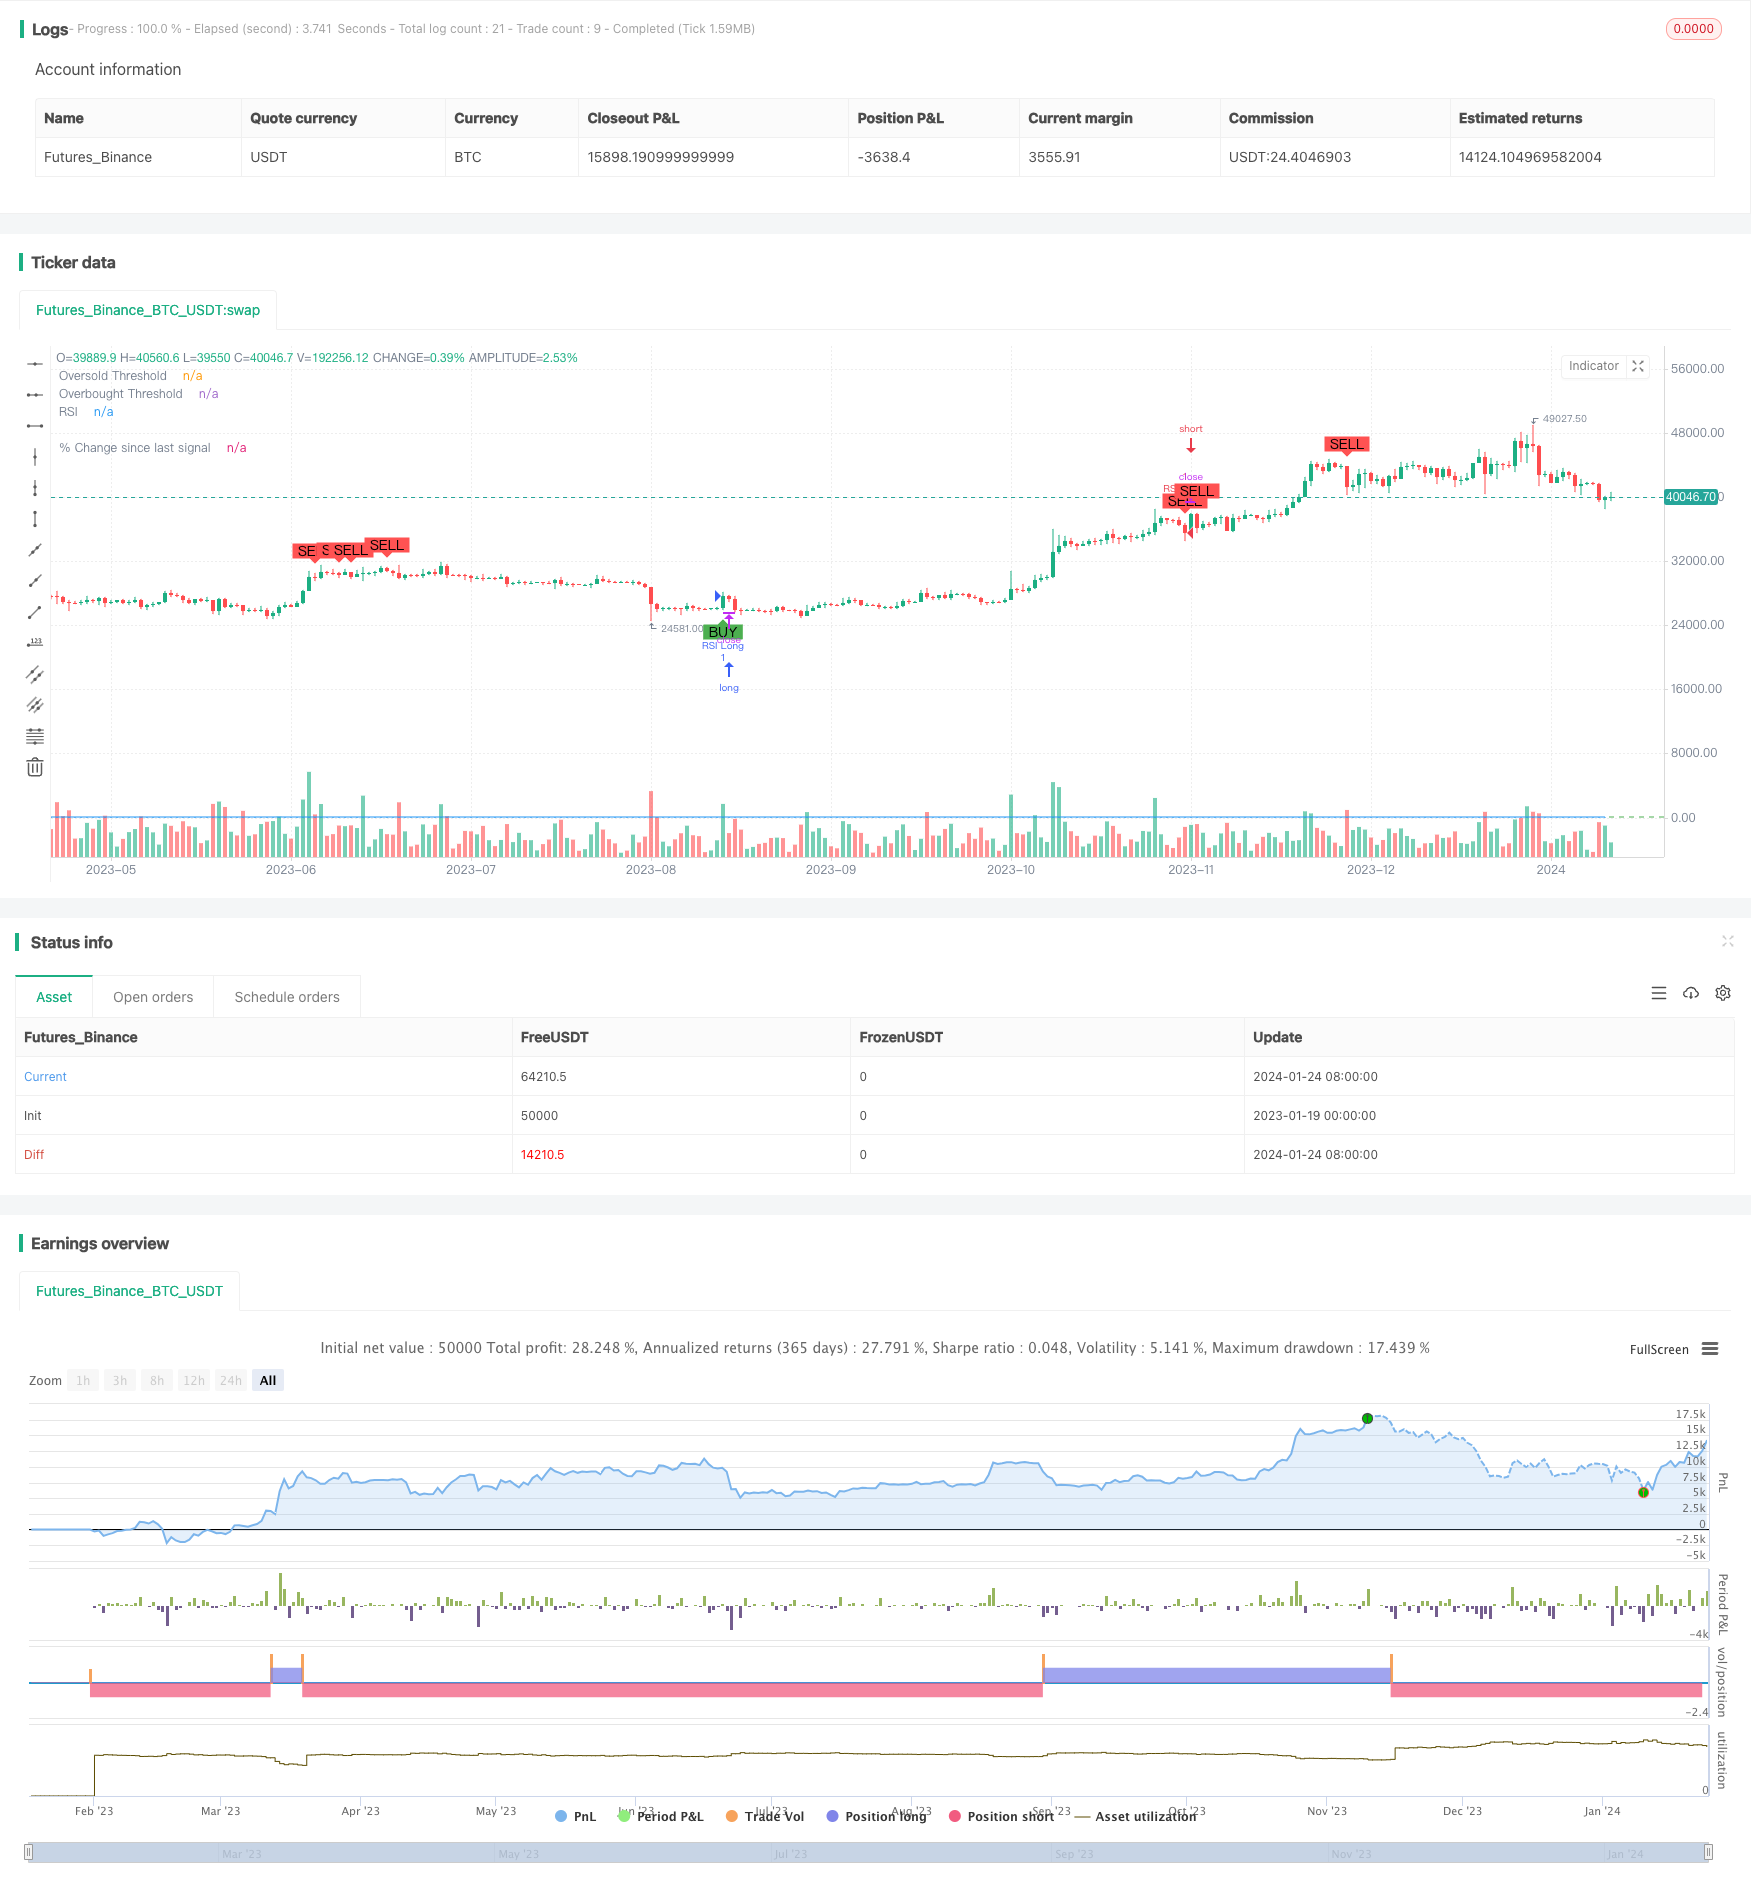
전략은 동시에 RSI 지표 곡선과 경량선을 그리는다. 가격 차트에서 문자 및 그래픽으로 구매 및 판매 신호를 표시한다. 또한, 전략은 지난 거래 신호 이후의 가격 변화의 비율을 계산하고 그리며, 거래자가 신호 이후의 가격 움직임을 직관적으로 볼 수 있게 한다.
우위 분석
- RSI를 통해 과매매를 판단할 수 있는 능력, 역전 기회를 효과적으로 식별할 수 있는 능력
- 시각화 된 거래 신호와 결합하여 입시 지점을 명확하게 볼 수 있습니다.
- 트렌드 반전의 효과를 판단하기 위해 이전 신호 이후의 비율 변화를 계산하고 표시합니다.
- RSI 매개 변수는 다양한 주기와 자산 거래에 맞게 사용자 정의 할 수 있습니다.
- 단독으로 사용할 수 있고, 다른 지표와 결합하여 전략의 효과를 높일 수 있습니다.
위험 분석
- RSI가 가짜 신호를 만들어 실제로 반전을 촉발하지 않을 가능성
- 역전 후의 추세는 지속성이 부족하고, 단기 조정일 수 있습니다.
- 높은 변동성으로 RSI가 실패할 확률이 높습니다.
- 거래 신호의 신뢰성을 보장하기 위해 수량과 가격 지표의 조합을 사용하는 것이 좋습니다.
- 허위 신호를 줄이기 위해 하락 영역을 적절히 조정하십시오.
최적화 방향
- 단편적 손실을 통제하기 위한 손해 방지 제도를 강화
- 이동 평균과 같은 지표와 함께 가짜 돌파구를 피하십시오.
- RSI 변수의 효과를 테스트하는 다양한 길이의 주기
- 시장 상황에 따라 오버 바이 오버 셀 영역의 하락을 최적화
- 포지션 관리 모듈을 추가하여 이윤 디스크가 지수 성장을 달성합니다.
요약하다
이 전략은 상대 강도 지수의 역전 거래 원칙을 통해 설계되었으며, 주요은 자산이 단기간에 명백한 과매매 과매매 현상이 나타나지 않는지 판단하여 후속 역전 기회를 잡습니다. 비율 변화를 계산하고 시각화 된 거래 팁과 함께 거래 결정을 보조 할 수 있습니다. RSI 파라미터는 사용자 정의가 가능하며 사용자는 개인 선호도에 따라 조정할 수 있습니다.
/*backtest
start: 2023-01-19 00:00:00
end: 2024-01-25 00:00:00
period: 1d
basePeriod: 1h
exchanges: [{"eid":"Futures_Binance","currency":"BTC_USDT"}]
*/

//@version=5
strategy("Improved RSI Strategy", overlay=true)

// Define RSI parameters
rsiLength = input(14, title="RSI Length")
rsiOversold = input(30, title="Oversold Threshold")
rsiOverbought = input(70, title="Overbought Threshold")

// Calculate RSI
rsiValue = ta.rsi(close, rsiLength)

// Define entry conditions
longCondition = ta.crossover(rsiValue, rsiOversold)
shortCondition = ta.crossunder(rsiValue, rsiOverbought)

// Plot RSI and thresholds
plot(rsiValue, title="RSI", color=color.blue)
hline(rsiOversold, title="Oversold Threshold", color=color.red)
hline(rsiOverbought, title="Overbought Threshold", color=color.green)

// Calculate percentage change since last signal
var float percentageChange = na
lastCloseValue = ta.valuewhen(longCondition or shortCondition, close, 1)

if longCondition or shortCondition
    percentageChange := (close - lastCloseValue) / lastCloseValue * 100

plot(percentageChange, color=color.blue, style=plot.style_histogram, linewidth=1, title="% Change since last signal")

// Execute strategy
if longCondition
    strategy.entry("RSI Long", strategy.long)

if shortCondition
    strategy.entry("RSI Short", strategy.short)

// Plot shapes and text for buy/sell signals
plotshape(series=longCondition, title="Buy Signal", location=location.belowbar, color=color.green, style=shape.labelup, text="BUY")
plotshape(series=shortCondition, title="Sell Signal", location=location.abovebar, color=color.red, style=shape.labeldown, text="SELL")