개요
이 전략은 수정된 거래량 진동기 지표에 기반하여 거래를 하는 트렌드 추적 전략이다. 거래량의 평균선을 사용하여 거래량이 증가한 신호를 식별하여 입점 또는 퇴출을 판단한다. 동시에 가격 자체의 트렌드 판단과 결합하여 가격 진동시 잘못된 신호를 피한다.
전략 원칙
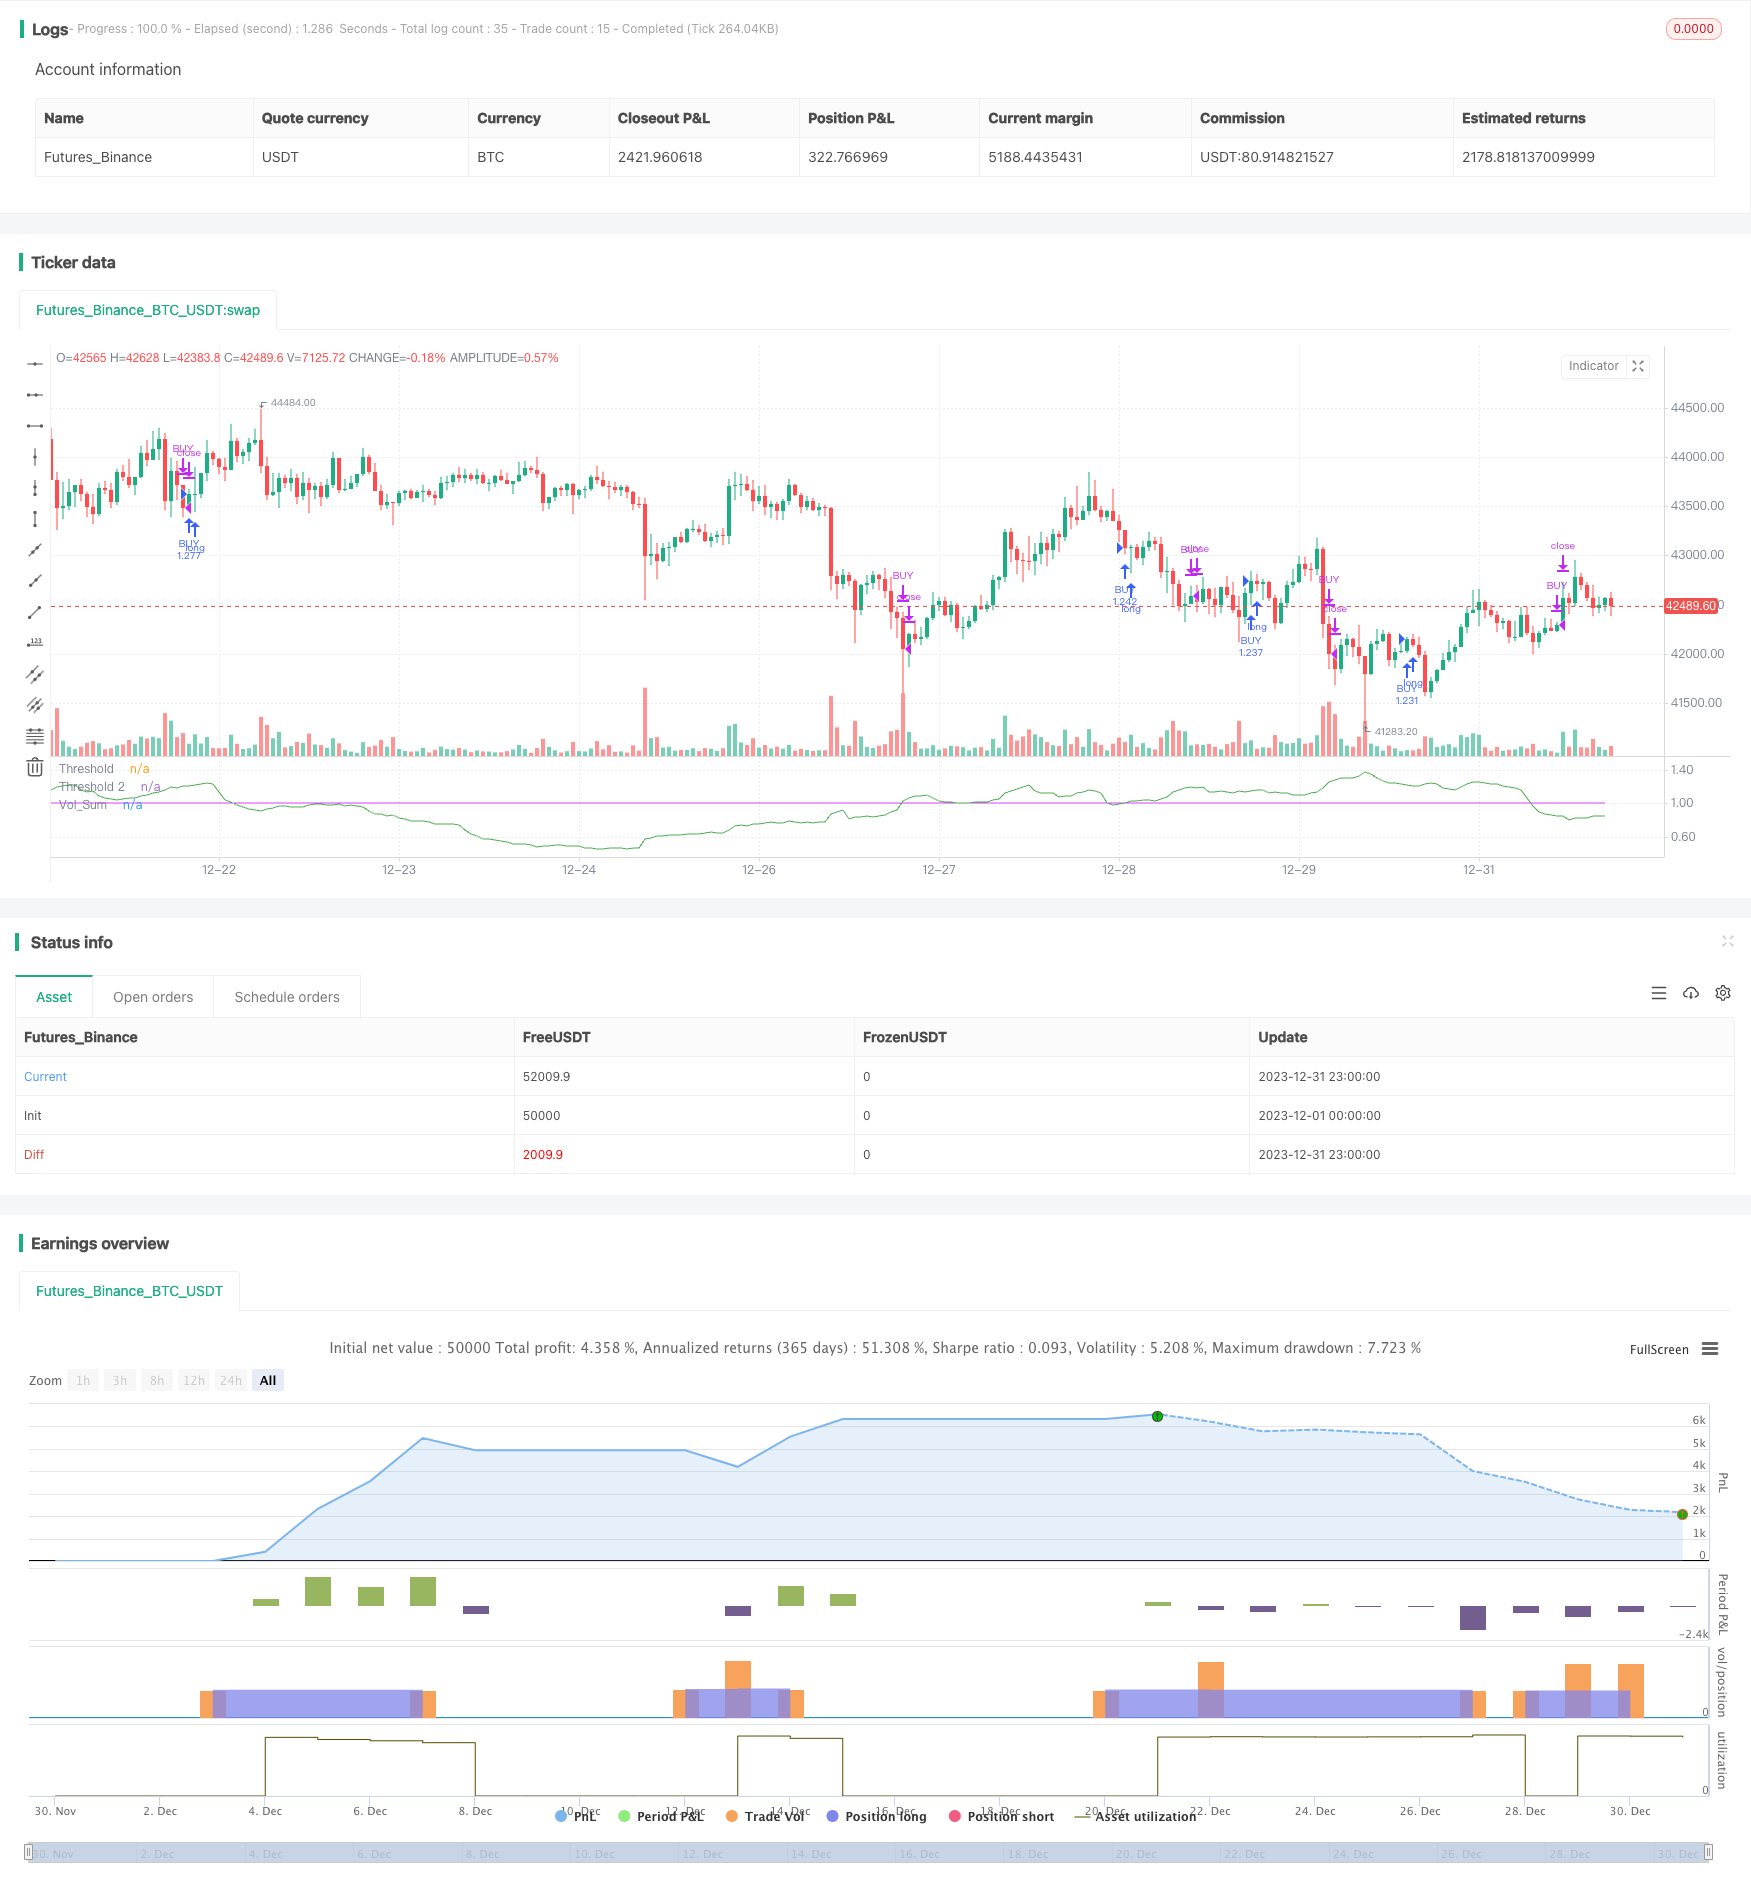
- 거래량의 평균선 vol_sum을 계산하고, 길이는 vol_length이며, vol_smooth 길이의 평균선 평준화를 수행한다.
- vol_sum의 상승이 절감수준을 넘으면 구매 신호가 발생하고, 절감수준을 넘으면 판매 신호가 발생한다.
- 오차 조작을 위해, 과거 direction근 K선과 종결 가격을 비교할 때, 가격 추세가 상승했을 때만 구매 작업을 수행한다. 가격 추세가 하락했을 때만 판매 작업을 수행한다.
- 두 개의 임계값 threshold와 threshold2을 설정한다. threshold는 거래 신호를 생성하고, threshold2는 손실을 방지한다.
- 상태 머신을 통해 주문을 관리하는 상반된 저장고 논리.
우위 분석
- 거래량 지표를 사용하면 시장의 구매 및 판매 경로의 변화를 포착하여 신호의 정확성을 향상시킬 수 있습니다.
- 가격 동향 판단과 함께 가격 변동시 잘못된 신호를 방지할 수 있다.
- 두 개의 마이너스를 사용하여 포지션을 개시하고 중지하면 위험을 더 잘 제어 할 수 있습니다.
위험 분석
- 거래량 지표 자체는 지연되어 가격 전환점을 놓칠 수 있습니다.
- 잘못된 파라미터를 설정하면 거래 빈도가 너무 높거나 신호가 지연될 수 있다.
- 거래량이 급증하는 시나리오에서, 스톱로디 포인트는 돌파될 수 있다.
이러한 위험은 변수를 조정하고, 지표 계산 방법을 최적화하고, 다른 지표와 결합하여 확인하여 제어할 수 있습니다.
최적화 방향
- 시장 상황에 따라 지표 파라미터를 자동으로 조정하는 적응 최적화를 고려할 수 있습니다.
- 가격 변동 지수와 같은 다른 지표와 결합하여 신호를 더 검증하여 정확도를 높일 수 있습니다.
- 기계학습 모델을 신호 판단에 적용하는 연구가 가능하며, 모델 판단을 사용하여 정확도를 높일 수 있다.
요약하다
이 전략은 개선된 거래량 진동기를 통해 가격 추세를 판단하는 데 도움을 주며 두 개의 하위 값을 설정하여 포지션을 개시하고 상쇄합니다. 전체적으로 안정적인 트렌드 추적 전략입니다. 최적화 공간은 주로 매개 변수 조정, 신호 필터링 및 상쇄 전략의 측면입니다.
전략 소스 코드
/*backtest
start: 2023-12-01 00:00:00
end: 2023-12-31 23:59:59
period: 1h
basePeriod: 15m
exchanges: [{"eid":"Futures_Binance","currency":"BTC_USDT"}]
*/

//@version=4
strategy('Volume Advanced', default_qty_type=strategy.percent_of_equity, default_qty_value=100, commission_type=strategy.commission.percent, commission_value=0.075, currency='USD')
startP = timestamp(input(2017, "Start Year"), input(12, "Start Month"), input(17, "Start Day"), 0, 0)
end    = timestamp(input(9999, "End Year"),   input(1, "End Month"),   input(1, "End Day"),   0, 0)
_testPeriod() =>
    iff(time >= startP and time <= end, true, false)

source = close
vol_length  = input(34, title = "Volume - Length")
vol_smooth  = input(200,title = "Volume - Smoothing")
volriselen  = input(21,  title = "Volume - Risinglength")
volfalllen  = input(13, title = "Volume - Fallinglength")
threshold   = input(1,"threshold")
threshold2  = input(1.2,step=0.1, title="Threshold 2")
direction = input(13,"amount of bars")


volsum  = sum(volume, vol_length) / (sum(volume, vol_smooth) / (vol_smooth / vol_length))


LongEntry  = (rising(volsum, volriselen) or crossover (volsum, threshold)) and close > close[direction]
ShortEntry = (rising(volsum, volriselen) or crossover (volsum, threshold)) and close < close[direction]
LongExit1  = falling (volsum,volfalllen)
ShortExit1 = falling (volsum,volfalllen)
LongExit2= (crossover(volsum, threshold2) and close < close[direction])


_state = 0
_prev = nz(_state[1])
_state := _prev

if _prev == 0
    if LongEntry
        _state := 1
        _state
    if ShortEntry
        _state := 2
        _state
if _prev == 1
    if ShortEntry or LongExit1
        _state := 0
        _state
if _prev == 2
    if LongEntry or ShortExit1
        _state := 0
        _state

_bLongEntry = _state == 1
_bLongClose = _state == 0

long_condition = _bLongEntry and close > close[direction]
strategy.entry('BUY', strategy.long, when=long_condition)

short_condition =  _bLongClose or LongExit2
strategy.close('BUY', when=short_condition)

plot(volsum,      color = color.green,    title="Vol_Sum")
plot(threshold, color = color.fuchsia, transp=50, title="Threshold")
plot(threshold2, color=color.white, transp = 50, title="Threshold 2")