개요
이중 MA 동량 돌파 전략은 이중 이동 평균과 RSI 지표를 결합한 양적 거래 전략이다. 이 전략은 빠른 이동 평균, 느린 이동 평균과 RSI 지표를 계산하여, 이동량 지표 RSI의 초매 초매 경계를 설정하고, 이중 MA가 금으로 교차할 때 더 많이 하고, 사다리 때 공백을 하고, 시장의 경향적인 행동을 포착한다.
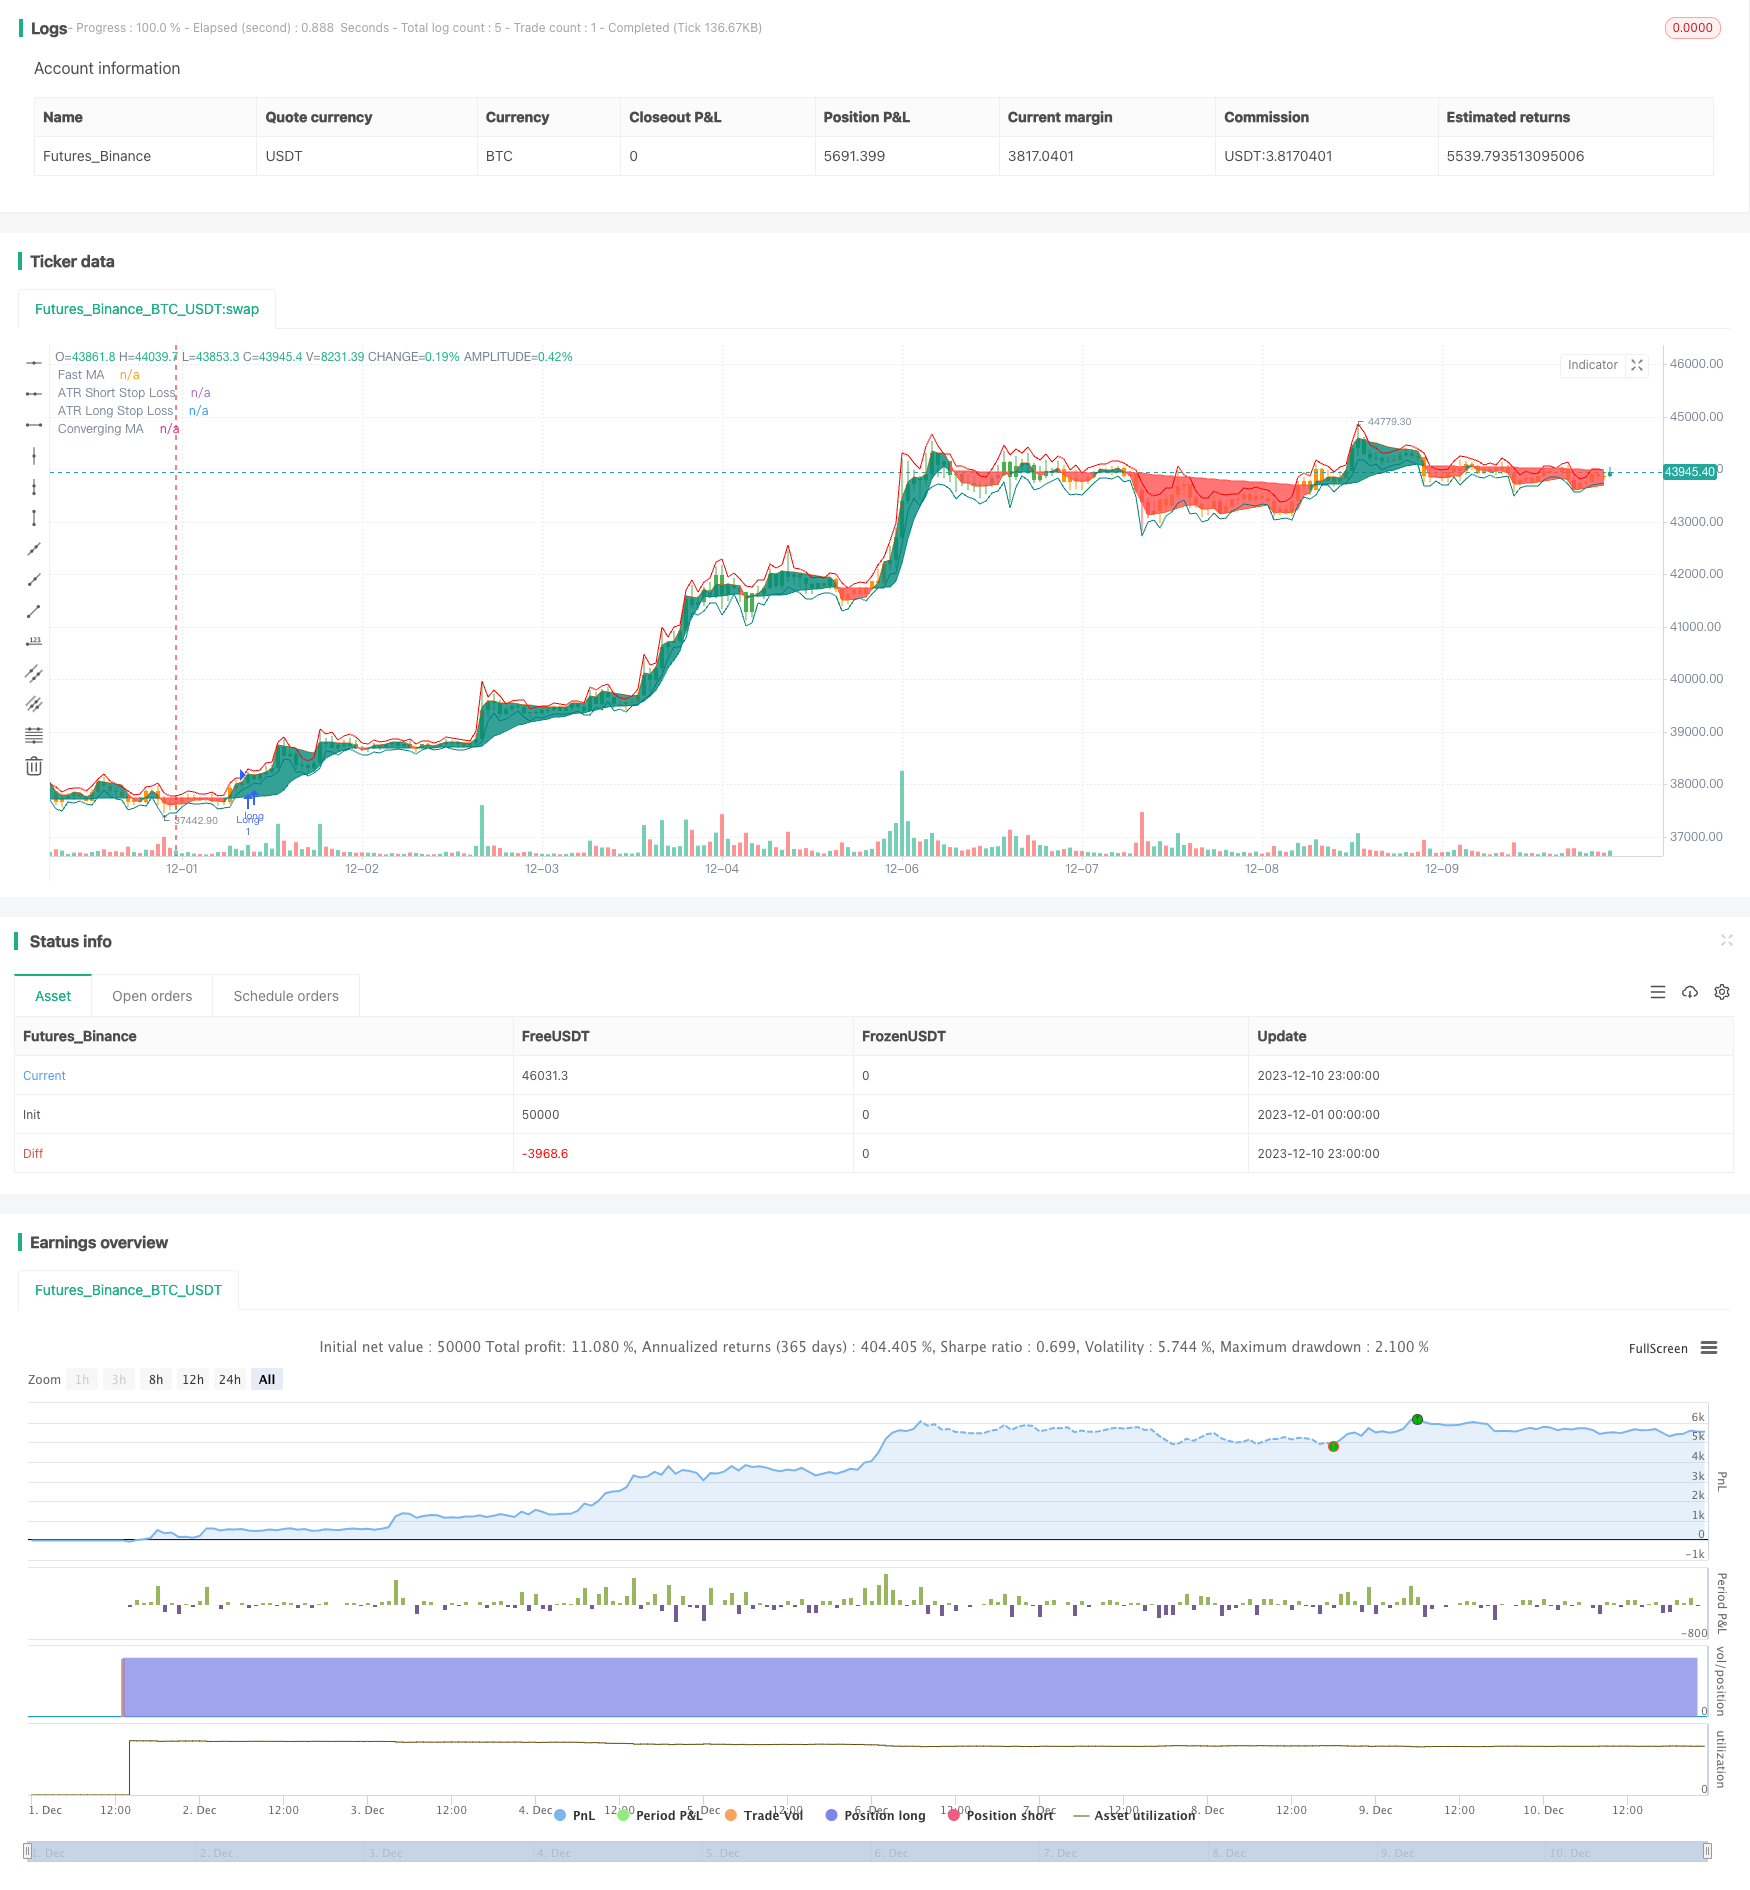
전략 원칙
이중 MA 동량 돌파 전략은 주로 두 개의 이동 평균과 RSI 지표를 기반으로 한다. 먼저 두 개의 이동 평균을 빠르게 천천히 계산하고, 빠른 선은 10 일 중화 이동 평균을, 느린 선은 100 일 선형 적응 이동 평균을 계산한다. 그 다음 14 일 RSI 지표를 계산하고, 오버 바이 오버 세일 임계 값을 설정한다. 빠른 선에서 느린 선을 통과 할 때 다머리 움직임으로 판단하고, 빠른 선 아래 느린 선을 통과 할 때 공허 한 움직임으로 판단한다.
구체적으로 말하면, 상향행동으로 판단될 때, 현재 RSI 지표가 초상구선보다 높으면 상향 포지션을 개시한다. 상향행동으로 판단될 때, RSI 지표가 초상구선보다 낮으면 상향 포지션을 개시한다. 포지션을 개시한 후, 거래 신호가 반전될 때 역향 포지션을 개시한다.
전략적 이점
이중 MA 동량 돌파 전략은 이중 MA와 RSI 지표를 결합하여 시장 추세를 효과적으로 식별하고 RSI 지표를 사용하여 가짜 돌파를 필터링하여 거래 신호의 신뢰성을 향상시킵니다. 단일 MA 시스템에 비해 이 전략은 무효 거래의 발생을 크게 줄일 수 있습니다. 또한 RSI 지표의 매개 변수 최적화는 전략에 유연성을 제공합니다.
전략적 위험
이중 MA 동량 돌파 전략에도 약간의 위험이 있습니다. 이중 MA 시스템은 매개 변수에 매우 민감하며, 다른 시장에 대한 신중한 테스트 매개 변수 조합이 필요합니다. 또한, RSI 지표가 부적절하게 설정된 마이너스는 잘못된 거래 기회를 초래할 수 있습니다. 마지막으로, 급진적인 이동 스톱 손실은 특정 상황에서 돌파 될 수 있으며, 피드백 결과에 따라 스톱 손실을 조정합니다.
전략 최적화
이중 MA 동량 돌파 전략은 다음과 같은 측면에서 최적화될 수 있다:
- 빠른 MA의 변수를 최적화하여 최적의 변수 조합을 찾습니다.
- RSI 변수를 최적화하여 오버 바이 오버 소드 마이너스를 조정합니다.
- 위험을 통제하기 위한 적응형 이동적 손해제도 증강
- 창고 개설량 최적화 모듈을 추가하고 자금 사용 효율성을 높여라.
요약하다
이중 MA 동량 돌파 전략은 이중 MA 시스템을 통해 트렌드 방향을 판단하고 RSI 지표 필터 신호를 사용하여 단일 MA 시스템의 단점을 효과적으로 개선 할 수 있습니다. 이 전략의 매개 변수를 최적화 할 수있는 공간이 넓고 적응 조정이 가능하며 우수한 트렌드 추적 전략입니다.
/*backtest
start: 2023-12-01 00:00:00
end: 2023-12-10 23:59:59
period: 1h
basePeriod: 15m
exchanges: [{"eid":"Futures_Binance","currency":"BTC_USDT"}]
*/

// This work is licensed under a Attribution-NonCommercial-ShareAlike 4.0 International (CC BY-NC-SA 4.0) https://creativecommons.org/licenses/by-nc-sa/4.0/
// © Salman4sgd

//@version=5
strategy("MAConverging + QQE Threshold Strategy", overlay = true)
//------------------------------------------------------------------------------
//Settings
//-----------------------------------------------------------------------------{
length = input(100)

incr   = input(10, "Increment")

fast   = input(10)

src    = input(close)

//-----------------------------------------------------------------------------}
//Calculations
//-----------------------------------------------------------------------------{
var ma    = 0.
var fma   = 0.
var alpha = 0.
var k     = 1 / incr

upper = ta.highest(length)
lower = ta.lowest(length)
init_ma = ta.sma(src, length)

cross = ta.cross(src,ma)

alpha := cross ? 2 / (length + 1)
  : src > ma and upper > upper[1] ? alpha + k
  : src < ma and lower < lower[1] ? alpha + k
  : alpha

ma := nz(ma[1] + alpha[1] * (src - ma[1]), init_ma)

fma := nz(cross ? math.avg(src, fma[1])
  : src > ma ? math.max(src, fma[1]) + (src - fma[1]) / fast
  : math.min(src, fma[1]) + (src - fma[1]) / fast,src)

//-----------------------------------------------------------------------------}
//Plots
//-----------------------------------------------------------------------------{
css = fma > ma ? color.teal : color.red

plot0 = plot(fma, "Fast MA"
  , color = #ff5d00
  , transp = 100)

plot1 = plot(ma, "Converging MA"
  , color = css)

fill(plot0, plot1, css
  , "Fill"
  , transp = 80)

//-----------------------------------------------------------------------------}

RSI_Period = input(14, title='RSI Length')
SF = input(5, title='RSI Smoothing')
QQE = input(4.238, title='Fast QQE Factor')
ThreshHold = input(10, title='Thresh-hold')
//
sQQEx = input(false, title='Show Smooth RSI, QQE Signal crosses')
sQQEz = input(false, title='Show Smooth RSI Zero crosses')
sQQEc = input(false, title='Show Smooth RSI Thresh Hold Channel Exits')
ma_type = input.string(title='MA Type', defval='EMA', options=['ALMA', 'EMA', 'DEMA', 'TEMA', 'WMA', 'VWMA', 'SMA', 'SMMA', 'HMA', 'LSMA', 'PEMA'])
lsma_offset = input.int(defval=0, title='* Least Squares (LSMA) Only - Offset Value', minval=0)
alma_offset = input.float(defval=0.85, title='* Arnaud Legoux (ALMA) Only - Offset Value', minval=0, step=0.01)
alma_sigma = input.int(defval=6, title='* Arnaud Legoux (ALMA) Only - Sigma Value', minval=0)
inpDrawBars = input(true, title='color bars?')


ma(type, src, len) =>
    float result = 0
    if type == 'SMA'  // Simple
        result := ta.sma(src, len)
        result
    if type == 'EMA'  // Exponential
        result := ta.ema(src, len)
        result
    if type == 'DEMA'  // Double Exponential
        e = ta.ema(src, len)
        result := 2 * e - ta.ema(e, len)
        result
    if type == 'TEMA'  // Triple Exponential
        e = ta.ema(src, len)
        result := 3 * (e - ta.ema(e, len)) + ta.ema(ta.ema(e, len), len)
        result
    if type == 'WMA'  // Weighted
        result := ta.wma(src, len)
        result
    if type == 'VWMA'  // Volume Weighted
        result := ta.vwma(src, len)
        result
    if type == 'SMMA'  // Smoothed
        w = ta.wma(src, len)
        result := na(w[1]) ? ta.sma(src, len) : (w[1] * (len - 1) + src) / len
        result
    if type == 'HMA'  // Hull
        result := ta.wma(2 * ta.wma(src, len / 2) - ta.wma(src, len), math.round(math.sqrt(len)))
        result
    if type == 'LSMA'  // Least Squares
        result := ta.linreg(src, len, lsma_offset)
        result
    if type == 'ALMA'  // Arnaud Legoux
        result := ta.alma(src, len, alma_offset, alma_sigma)
        result
    if type == 'PEMA'
        // Copyright (c) 2010-present, Bruno Pio
        // Copyright (c) 2019-present, Alex Orekhov (everget)
        // Pentuple Exponential Moving Average script may be freely distributed under the MIT license.
        ema1 = ta.ema(src, len)
        ema2 = ta.ema(ema1, len)
        ema3 = ta.ema(ema2, len)
        ema4 = ta.ema(ema3, len)
        ema5 = ta.ema(ema4, len)
        ema6 = ta.ema(ema5, len)
        ema7 = ta.ema(ema6, len)
        ema8 = ta.ema(ema7, len)
        pema = 8 * ema1 - 28 * ema2 + 56 * ema3 - 70 * ema4 + 56 * ema5 - 28 * ema6 + 8 * ema7 - ema8
        result := pema
        result
    result

src := input(close, title='RSI Source')
//

//
Wilders_Period = RSI_Period * 2 - 1


Rsi = ta.rsi(src, RSI_Period)
RsiMa = ma(ma_type, Rsi, SF)
AtrRsi = math.abs(RsiMa[1] - RsiMa)
MaAtrRsi = ma(ma_type, AtrRsi, Wilders_Period)
dar = ma(ma_type, MaAtrRsi, Wilders_Period) * QQE

longband = 0.0
shortband = 0.0
trend = 0

DeltaFastAtrRsi = dar
RSIndex = RsiMa
newshortband = RSIndex + DeltaFastAtrRsi
newlongband = RSIndex - DeltaFastAtrRsi
longband := RSIndex[1] > longband[1] and RSIndex > longband[1] ? math.max(longband[1], newlongband) : newlongband
shortband := RSIndex[1] < shortband[1] and RSIndex < shortband[1] ? math.min(shortband[1], newshortband) : newshortband
cross_1 = ta.cross(longband[1], RSIndex)
trend := ta.cross(RSIndex, shortband[1]) ? 1 : cross_1 ? -1 : nz(trend[1], 1)
FastAtrRsiTL = trend == 1 ? longband : shortband

//
// Find all the QQE Crosses
QQExlong = 0
QQExlong := nz(QQExlong[1])
QQExshort = 0
QQExshort := nz(QQExshort[1])
QQExlong := sQQEx and FastAtrRsiTL < RSIndex ? QQExlong + 1 : 0
QQExshort := sQQEx and FastAtrRsiTL > RSIndex ? QQExshort + 1 : 0
// Zero cross
QQEzlong = 0
QQEzlong := nz(QQEzlong[1])
QQEzshort = 0
QQEzshort := nz(QQEzshort[1])
QQEzlong := sQQEz and RSIndex >= 50 ? QQEzlong + 1 : 0
QQEzshort := sQQEz and RSIndex < 50 ? QQEzshort + 1 : 0
//
// Thresh Hold channel Crosses give the BUY/SELL alerts.
QQEclong = 0
QQEclong := nz(QQEclong[1])
QQEcshort = 0
QQEcshort := nz(QQEcshort[1])
QQEclong := sQQEc and RSIndex > 50 + ThreshHold ? QQEclong + 1 : 0
QQEcshort := sQQEc and RSIndex < 50 - ThreshHold ? QQEcshort + 1 : 0


// // QQE exit from Thresh Hold Channel
// plotshape(sQQEc and QQEclong == 1 ? RsiMa - 50 : na, title='QQE XC Over Channel', style=shape.diamond, location=location.absolute, color=color.new(color.olive, 0), size=size.small, offset=0)
// plotshape(sQQEc and QQEcshort == 1 ? RsiMa - 50 : na, title='QQE XC Under Channel', style=shape.diamond, location=location.absolute, color=color.new(color.red, 0), size=size.small, offset=0)
// // QQE crosses
// plotshape(sQQEx and QQExlong == 1 ? FastAtrRsiTL[1] - 50 : na, title='QQE XQ Cross Over', style=shape.circle, location=location.absolute, color=color.new(color.lime, 0), size=size.small, offset=-1)
// plotshape(sQQEx and QQExshort == 1 ? FastAtrRsiTL[1] - 50 : na, title='QQE XQ Cross Under', style=shape.circle, location=location.absolute, color=color.new(color.blue, 0), size=size.small, offset=-1)
// // Signal crosses zero line
// plotshape(sQQEz and QQEzlong == 1 ? RsiMa - 50 : na, title='QQE XZ Zero Cross Over', style=shape.square, location=location.absolute, color=color.new(color.aqua, 0), size=size.small, offset=0)
// plotshape(sQQEz and QQEzshort == 1 ? RsiMa - 50 : na, title='QQE XZ Zero Cross Under', style=shape.square, location=location.absolute, color=color.new(color.fuchsia, 0), size=size.small, offset=0)

// hcolor = RsiMa - 50 > ThreshHold ? color.green : RsiMa - 50 < 0 - ThreshHold ? color.red : color.orange
// plot(FastAtrRsiTL - 50, color=color.new(color.blue, 0), linewidth=2)
// p1 = plot(RsiMa - 50, color=color.new(color.orange, 0), linewidth=2)
// plot(RsiMa - 50, color=hcolor, style=plot.style_columns, transp=50)


// hZero = hline(0, color=color.black, linestyle=hline.style_dashed, linewidth=1)
// hUpper = hline(ThreshHold, color=color.green, linestyle=hline.style_dashed, linewidth=2)
// hLower = hline(0 - ThreshHold, color=color.red, linestyle=hline.style_dashed, linewidth=2)
// fill(hUpper, hLower, color=color.new(color.gray, 80))
//EOF

length := input.int(title='ATR Length', defval=14, minval=1)
smoothing = input.string(title='ATR Smoothing', defval='RMA', options=['RMA', 'SMA', 'EMA', 'WMA'])
m = input(0.3, 'ATR Multiplier')
src1 = input(high)
src2 = input(low)
pline = input(true, 'Show Price Lines')
col1 = input(color.blue, 'ATR Text Color')
col2 = input.color(color.teal, 'Low Text Color', inline='1')
col3 = input.color(color.red, 'High Text Color', inline='2')

collong = input.color(color.teal, 'Low Line Color', inline='1')
colshort = input.color(color.red, 'High Line Color', inline='2')

ma_function(source, length) =>
    if smoothing == 'RMA'
        ta.rma(source, length)
    else
        if smoothing == 'SMA'
            ta.sma(source, length)
        else
            if smoothing == 'EMA'
                ta.ema(source, length)
            else
                ta.wma(source, length)

a = ma_function(ta.tr(true), length) * m
s_sl = ma_function(ta.tr(true), length) * m + src1
l_sl = src2 - ma_function(ta.tr(true), length) * m

p1 = plot(s_sl, title='ATR Short Stop Loss', color=colshort, trackprice=pline ? true : false, transp=20)
p2 = plot(l_sl, title='ATR Long Stop Loss', color=collong, trackprice=pline ? true : false, transp=20)


bgc = RsiMa - 50 > ThreshHold ? color.green : Rsi - 50 < 0 - ThreshHold ? color.red : color.orange
barcolor(inpDrawBars ? bgc : na)
prebuy = RsiMa - 50 > ThreshHold
buy=prebuy and not(prebuy[1]) and fma > ma

var long_tp=0.0
var long_sl=0.0
var short_tp=0.0
var short_sl=0.0

if prebuy
    strategy.close("Short")


if buy and strategy.position_size<=0
    strategy.entry("Long", strategy.long)
    long_sl:=l_sl
    long_tp:=close+(close-long_sl)*2


//if strategy.position_size>0
strategy.exit("L_SL","Long",stop=long_sl)
    //strategy.exit("L_SL","Long",stop=long_sl)
// if low<long_sl[1]
//     strategy.close("Long")

presell=RsiMa - 50 < 0 - ThreshHold // RsiMa - 50 < 0 - ThreshHold
sell= presell and not(presell[1]) and fma < ma

//plotshape(presell)

if presell
    strategy.close("Long")

if sell and strategy.position_size>=0
    strategy.entry("Short", strategy.short)
    short_sl:=s_sl
    short_tp:=close-(short_sl-close)*2

//if strategy.position_size<0
strategy.exit("S_SL","Short",stop=short_sl)
    //strategy.exit("S_SL","Short",stop=short_sl)