개요
이 전략은 동적으로 조정되는 거래망을 구축하여 변동적인 상황에서 안정적인 수익을 달성합니다. 이 전략은 설정된 격자 수에 따라 격자 간격과 상하계 가격을 자동으로 계산합니다. 가격이 각 격자 라인을 돌파 할 때, 부채를 더 많이 만들거나 공백을 만들 수 있습니다. 가격이 원래의 격자 라인을 다시 만질 때, 점진적으로 포지션을 평준합니다. 이 전략은 수동 및 자동으로 격자 매개 변수를 조정하여 시장 환경 변화에 적응 할 수 있습니다.
전략 원칙
입력 변수에 따라 그리드 경계와 그리드 라인 가격 배열을 계산한다.
가격이 특정 격자선보다 낮고 그 격자선에는 대응하는 상장서가 없을 때, 그 격자선 가격점에서 더 많은 상장서가 만들어진다. 가격이 상위 격자선 ((첫 번째를 제외한) 보다 높고 상위 격자선에는 대응하는 소장서가 있을 때, 상위 격자선에서 대응하는 더 많은 상장서가 평면화된다.
자동 조정 그리드 파라미터를 활성화하면, 최근 K선 데이터의 일정한 수에 따라 그리드의 상하위 한도 가격, 그리드 간격 및 그리드 배열을 주기적으로 재 계산한다.
우위 분석
변동성 상황에서 수익을 달성하는 목표. 상승성 상황에서, 다양한 가격 지점에서 대량으로 보유 지점과 평준화 지점을 구축하여 전반적으로 수익을 달성 할 수 있습니다.
수동 또는 자동으로 격자 매개 변수를 조정할 수 있습니다. 수동 조정에는 인적 개입이 필요하지만 더 제어 할 수 있습니다. 자동 조정은 운영 작업량을 줄여서 전략이 시장 환경 변화에 적응 할 수 있습니다.
최대 격자 수를 제한함으로써 일방적 위험을 제어할 수 있다. 가격들이 모든 격자선을 뚫고 지나갈 때, 이 방향의 위험은 통제된다.
격자 간격을 조정하여 각 단위의 적자를 조절할 수 있다. 격자 간격을 줄이면 단위의 적자를 줄일 수 있다.
위험 분석
큰 변동이 있는 상황에서는, 중매의 위험성이 존재한다. 가격들이 여러 격자 사이에 빠르게 오르고 돌아가는 경우, 중매의 위험성이 있을 수 있다.
합리적인 초기 자금을 설정해야 합니다. 초기 자금이 부족하면 충분한 수의 그리드 라인을 지원할 수 없습니다.
너무 큰 또는 너무 작은 격자 수는 전략 수익에 좋지 않습니다. 격자 수가 너무 적으면 변동성을 충분히 활용할 수 없습니다. 너무 많으면 단일 손실이 너무 작습니다. 최적의 매개 변수를 결정하는 테스트가 필요합니다.
자동 조정 그리드 매개 변수가 조작될 위험이 있다. 그리드 매개 변수의 계산은 특정 K 선 수에 의존하며, 단기 운영에 영향을 받을 수 있다.
최적화 방향
스톱 로직을 추가한다. 플로잉 스톱이나 스톱 트래킹을 설정하여 일방적인 손실 위험을 더욱 제어한다.
알고리즘에 그리드 파라미터를 최적화한다. 다양한 시장 단계의 파라미터 설정을 테스트하고, 기계 학습 방법을 사용하여 모델을 훈련하여 파라미터를 자동으로 최적화한다.
더 많은 지표와 결합하여 상황을 판단한다. MACD, KD와 같은 판단은 현재 상승 추세 또는 하향 추세에 있으며, 그리드 수 또는 변수를 조정한다.
회수 통제를 최적화한다. 예를 들어 최대 회수 비율을 설정하고, 마이너스가 도달했을 때 전략을 종료하여 손실이 더 확대되는 것을 방지한다.
요약하다
이 전략은 변동적 행태의 특성을 충분히 활용하여, 동적 격자 거래를 통해 안정적인 수익을 달성하는 목표를 달성한다. 이 전략은 파라미터 설정의 유연성을 고려하면서도, 작업의 강도를 감소시킨다. 변동적 행태에서 이 전략은 이상적인 수익 선택이라고 할 수 있다. 향후 추가적인 최적화를 통해, 전략의 적용 시나리오를 더 넓히고, 회수 제어를 더 잘하고, 더 지속적인 안정적인 수익을 창출할 수 있다.
/*backtest
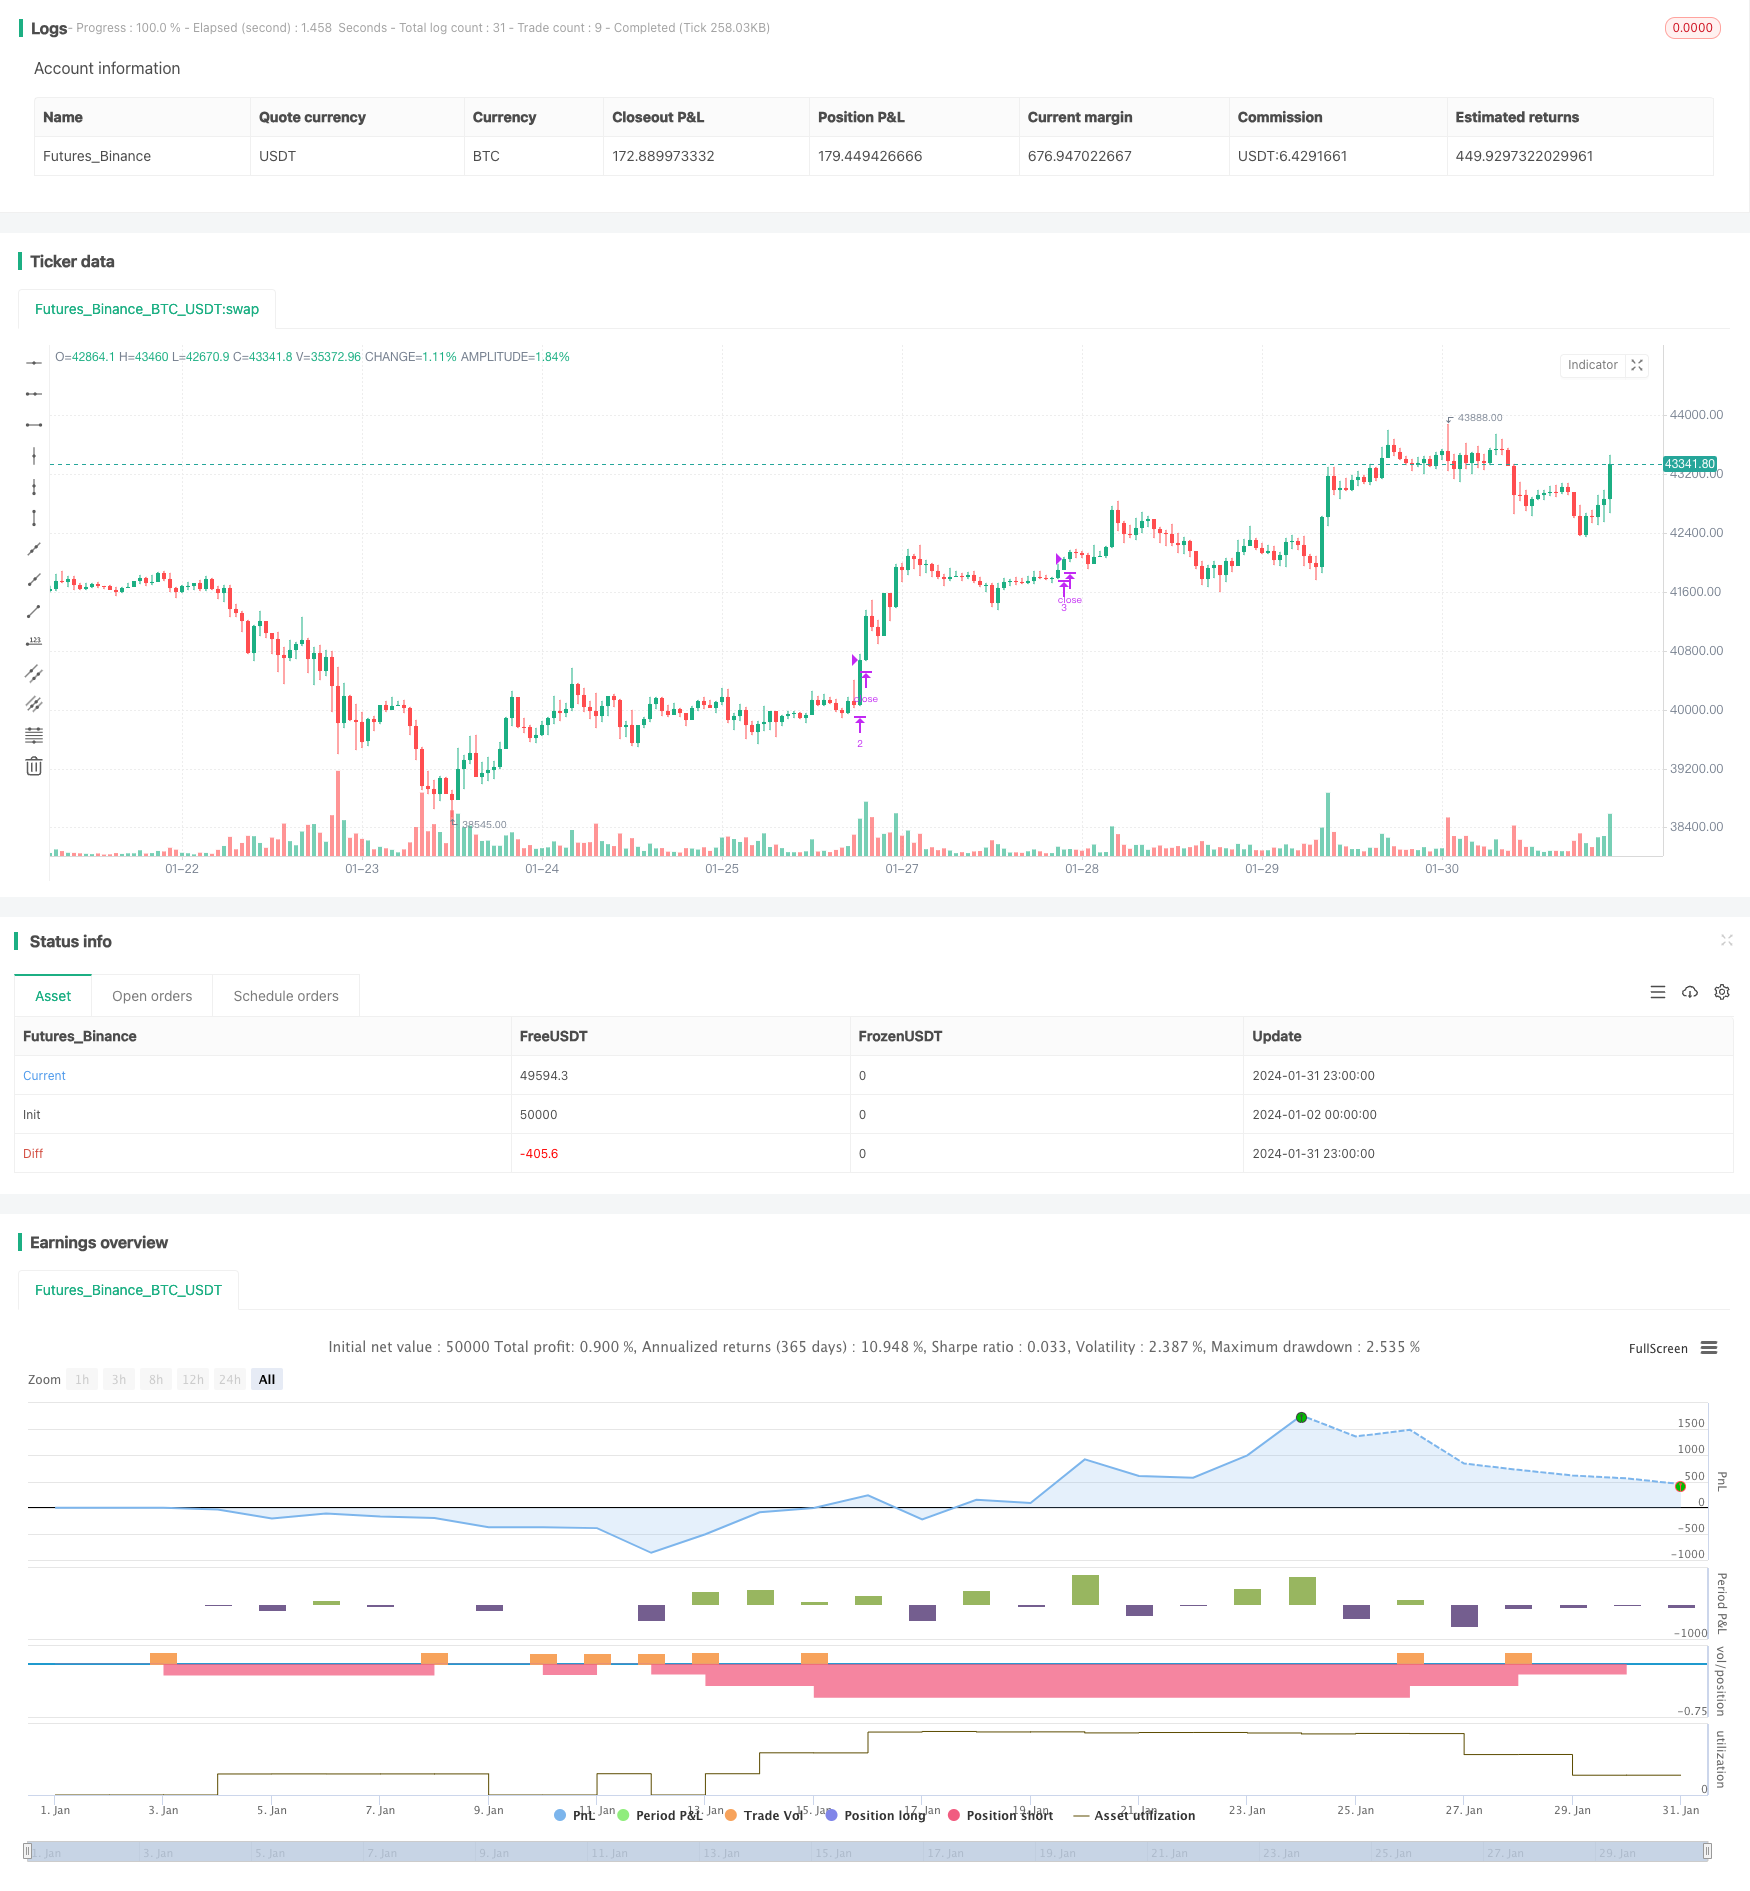
start: 2024-01-02 00:00:00
end: 2024-02-01 00:00:00
period: 1h
basePeriod: 15m
exchanges: [{"eid":"Futures_Binance","currency":"BTC_USDT"}]
*/
//@version=4
strategy("(IK) Grid Script", overlay=true, pyramiding=14, close_entries_rule="ANY", default_qty_type=strategy.cash, initial_capital=100.0, currency="USD", commission_type=strategy.commission.percent, commission_value=0.1)
i_autoBounds = input(group="Grid Bounds", title="Use Auto Bounds?", defval=true, type=input.bool) // calculate upper and lower bound of the grid automatically? This will theorhetically be less profitable, but will certainly require less attention
i_boundSrc = input(group="Grid Bounds", title="(Auto) Bound Source", defval="Hi & Low", options=["Hi & Low", "Average"]) // should bounds of the auto grid be calculated from recent High & Low, or from a Simple Moving Average
i_boundLookback = input(group="Grid Bounds", title="(Auto) Bound Lookback", defval=250, type=input.integer, maxval=500, minval=0) // when calculating auto grid bounds, how far back should we look for a High & Low, or what should the length be of our sma
i_boundDev = input(group="Grid Bounds", title="(Auto) Bound Deviation", defval=0.10, type=input.float, maxval=1, minval=-1) // if sourcing auto bounds from High & Low, this percentage will (positive) widen or (negative) narrow the bound limits. If sourcing from Average, this is the deviation (up and down) from the sma, and CANNOT be negative.
i_upperBound = input(group="Grid Bounds", title="(Manual) Upper Boundry", defval=0.285, type=input.float) // for manual grid bounds only. The upperbound price of your grid
i_lowerBound = input(group="Grid Bounds", title="(Manual) Lower Boundry", defval=0.225, type=input.float) // for manual grid bounds only. The lowerbound price of your grid.
i_gridQty = input(group="Grid Lines", title="Grid Line Quantity", defval=8, maxval=15, minval=3, type=input.integer) // how many grid lines are in your grid
f_getGridBounds(_bs, _bl, _bd, _up) =>
if _bs == "Hi & Low"
_up ? highest(close, _bl) * (1 + _bd) : lowest(close, _bl) * (1 - _bd)
else
avg = sma(close, _bl)
_up ? avg * (1 + _bd) : avg * (1 - _bd)
f_buildGrid(_lb, _gw, _gq) =>
gridArr = array.new_float(0)
for i=0 to _gq-1
array.push(gridArr, _lb+(_gw*i))
gridArr
f_getNearGridLines(_gridArr, _price) =>
arr = array.new_int(3)
for i = 0 to array.size(_gridArr)-1
if array.get(_gridArr, i) > _price
array.set(arr, 0, i == array.size(_gridArr)-1 ? i : i+1)
array.set(arr, 1, i == 0 ? i : i-1)
break
arr
var upperBound = i_autoBounds ? f_getGridBounds(i_boundSrc, i_boundLookback, i_boundDev, true) : i_upperBound // upperbound of our grid
var lowerBound = i_autoBounds ? f_getGridBounds(i_boundSrc, i_boundLookback, i_boundDev, false) : i_lowerBound // lowerbound of our grid
var gridWidth = (upperBound - lowerBound)/(i_gridQty-1) // space between lines in our grid
var gridLineArr = f_buildGrid(lowerBound, gridWidth, i_gridQty) // an array of prices that correspond to our grid lines
var orderArr = array.new_bool(i_gridQty, false) // a boolean array that indicates if there is an open order corresponding to each grid line
var closeLineArr = f_getNearGridLines(gridLineArr, close) // for plotting purposes - an array of 2 indices that correspond to grid lines near price
var nearTopGridLine = array.get(closeLineArr, 0) // for plotting purposes - the index (in our grid line array) of the closest grid line above current price
var nearBotGridLine = array.get(closeLineArr, 1) // for plotting purposes - the index (in our grid line array) of the closest grid line below current price
strategy.initial_capital = 50000
for i = 0 to (array.size(gridLineArr) - 1)
if close < array.get(gridLineArr, i) and not array.get(orderArr, i) and i < (array.size(gridLineArr) - 1)
buyId = i
array.set(orderArr, buyId, true)
strategy.entry(id=tostring(buyId), long=true, qty=(strategy.initial_capital/(i_gridQty-1))/close, comment="#"+tostring(buyId))
if close > array.get(gridLineArr, i) and i != 0
if array.get(orderArr, i-1)
sellId = i-1
array.set(orderArr, sellId, false)
strategy.close(id=tostring(sellId), comment="#"+tostring(sellId))
if i_autoBounds
upperBound := f_getGridBounds(i_boundSrc, i_boundLookback, i_boundDev, true)
lowerBound := f_getGridBounds(i_boundSrc, i_boundLookback, i_boundDev, false)
gridWidth := (upperBound - lowerBound)/(i_gridQty-1)
gridLineArr := f_buildGrid(lowerBound, gridWidth, i_gridQty)
closeLineArr := f_getNearGridLines(gridLineArr, close)
nearTopGridLine := array.get(closeLineArr, 0)
nearBotGridLine := array.get(closeLineArr, 1)