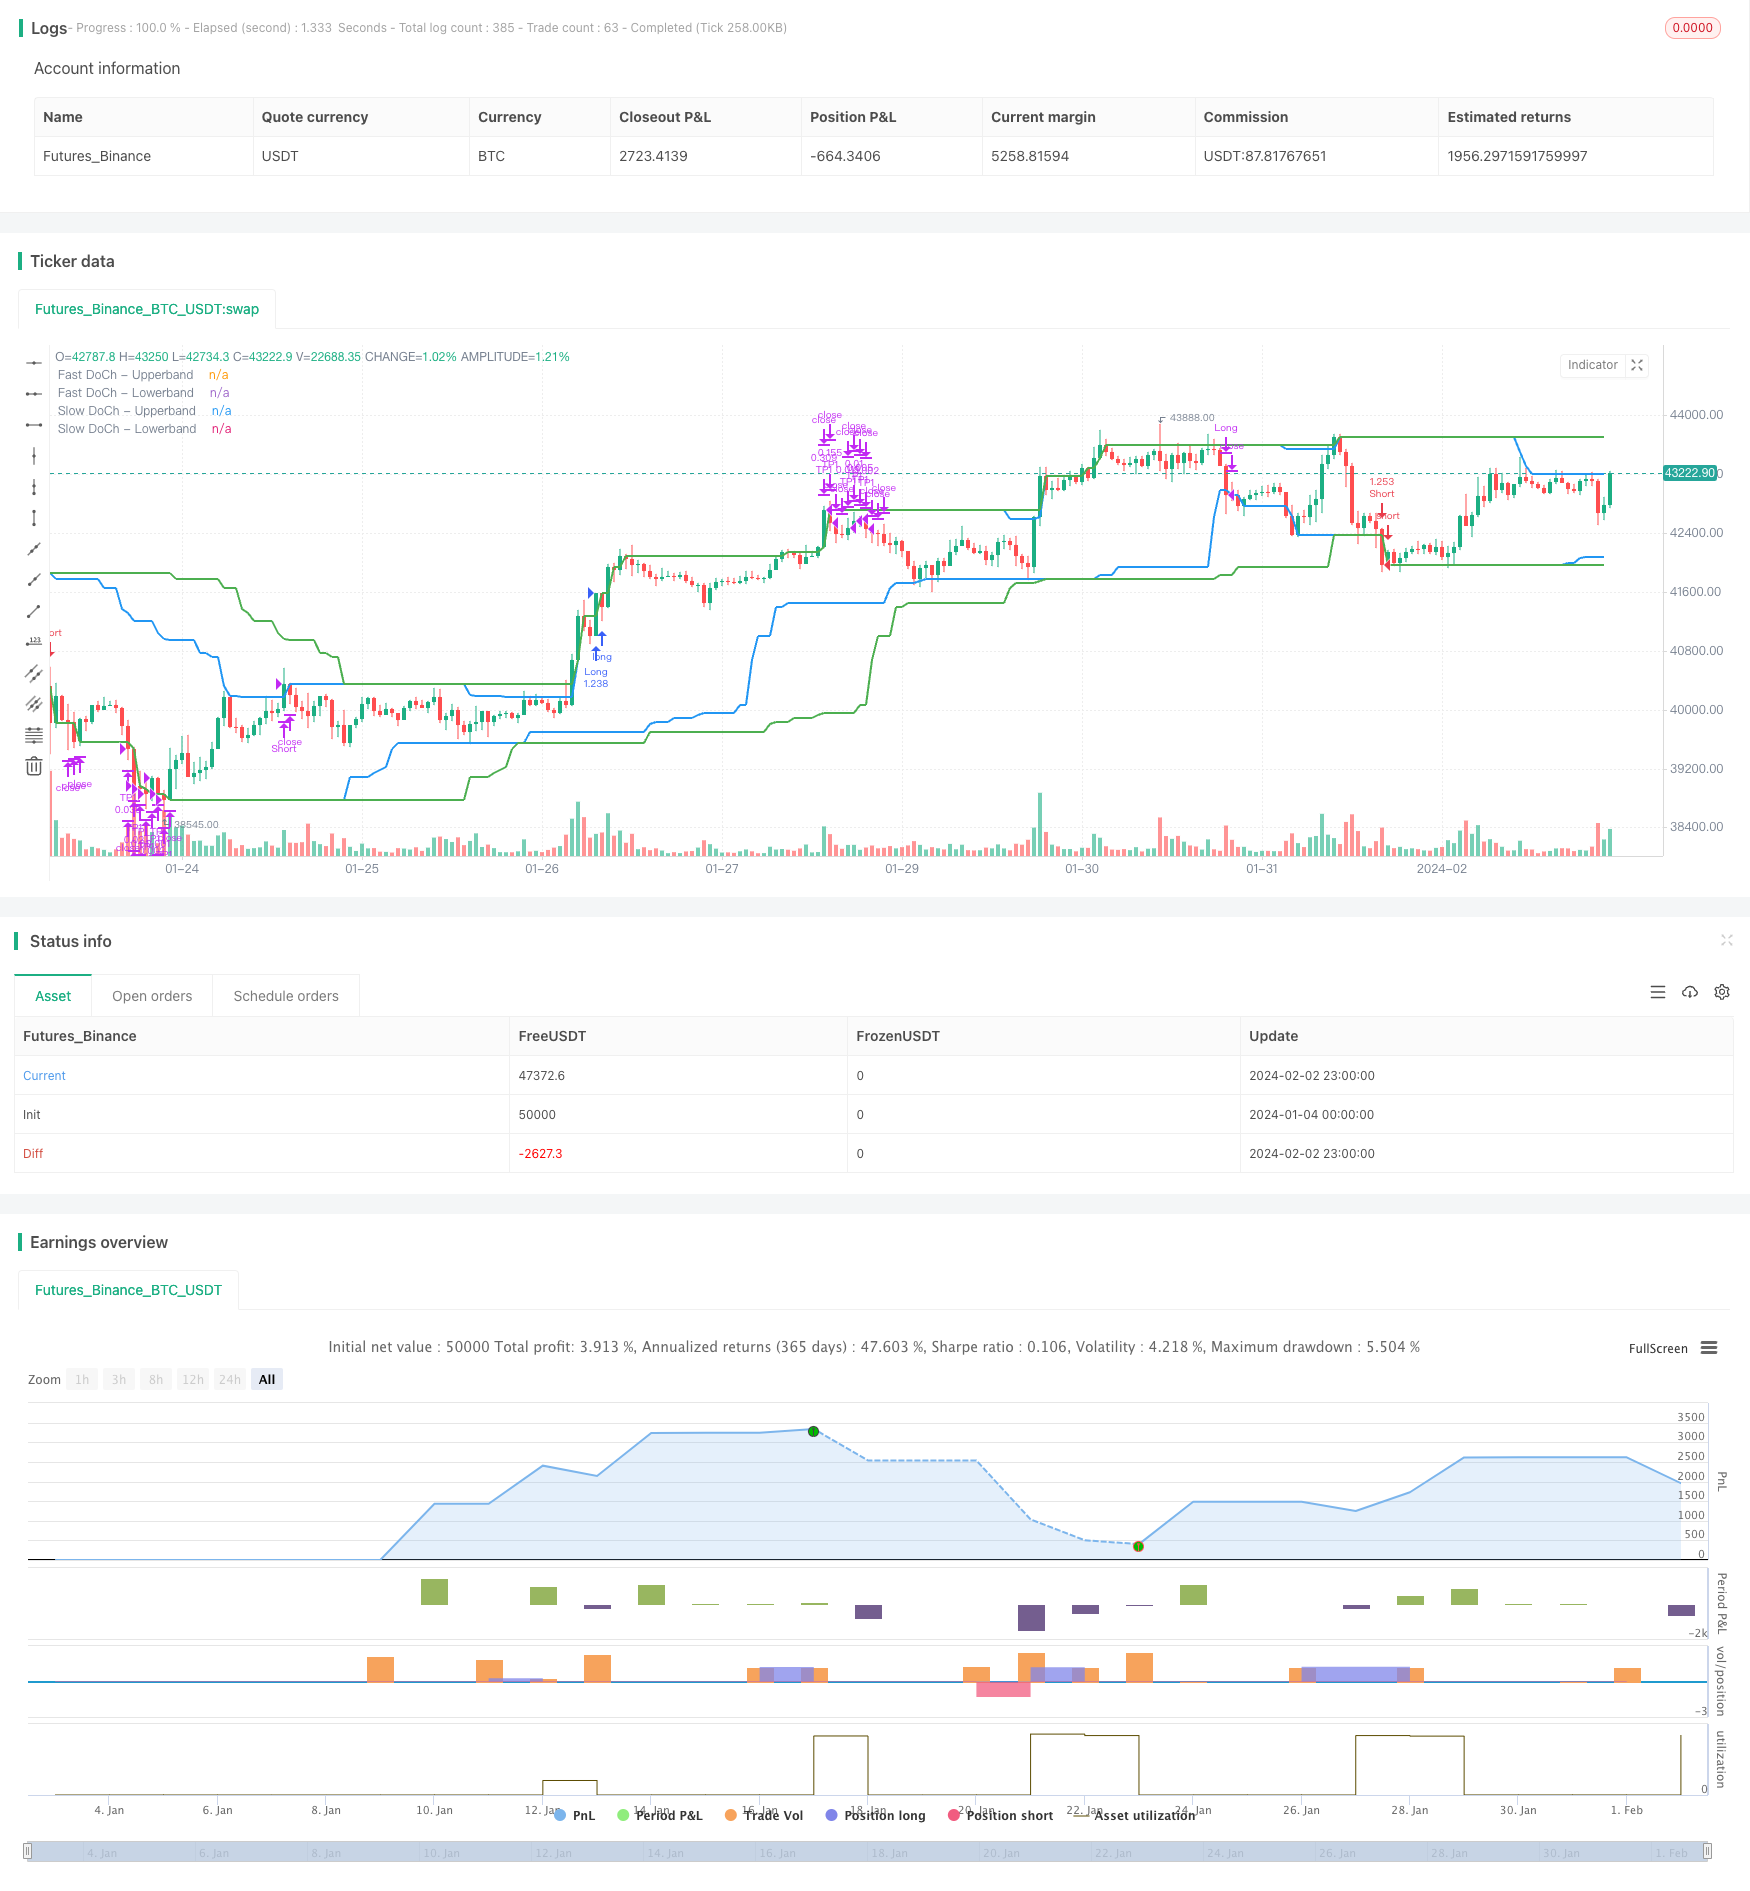
개요
쌍동치안 통로 돌파 전략은 동치안 통로에 기반한 양적 거래 전략이다. 이 전략은 빠른 동치안 통로와 느린 동치안 통로를 조합하여 낮은 위험과 높은 수익을 창출하는 돌파 거래를 실현한다. 가격이 느린 통로를 돌파 할 때 입장은 더 많은 / 공백, 가격이 빠른 통로를 다시 돌파 할 때 중단 또는 중지한다.
전략 원칙
이 전략은 주로 두 개의 동치안 통로를 기반으로 하고 있는데, 하나는 더 긴 주기의 느린 동치안 통로, 하나는 더 짧은 주기의 빠른 동치안 통로이다.
느린 도치안 통로의 주기가 길고, 시장의 잡음을 효과적으로 제거 할 수 있으며, 돌파 신호는 높은 신뢰성을 가지고 있다. 가격이 느린 통로 상도를 돌파 할 때, 더 많은 입장을 취하고; 가격이 느린 통로 하도를 돌파 할 때, 공백 입장을 취한다.
빠른 동치안 통로의 주기는 짧고, 단기 가격 변화에 빠르게 반응할 수 있다. 가격이 이 통로를 다시 돌파할 때, 트렌드가 변한 것을 나타내며, 즉시 손실을 중지하거나 멈출 필요가 있다.
또한, 변동률 조건이 전략의 입문 필터로 설정되어 있다. 가격 변동이 미리 설정된 하위값 비율을 초과할 때만 입장을 촉발한다. 이것은 가로 수직 정리에서 자주 입장을 피할 수 있다.
우위 분석
- 이중 통로를 사용하여 두 개의 방어선을 설정하여 위험을 효과적으로 제어할 수 있습니다.
- 트렌드 캡처를 위한 신속하고 느린 통로
- 변동성 필터링 메커니즘은 무효 거래를 줄일 수 있습니다.
- 트렌드 추적과 범주 축소 방지
- 규칙은 명확하고 간단하며, 이해하기 쉬워졌습니다.
위험 분석
- 현황이 급격하게 변할 때, 스톱로디 포인트가 뚫려서 큰 손실을 초래할 수 있다.
- 변수 설정을 잘못하면 정책 효과가 저하될 수 있습니다.
- 거래 비용도 수익에 영향을 미칩니다.
- 주요 사건으로 인한 하락상황에 주의를 기울여야 합니다.
이러한 위험은 최적화 변수, 합리적인 스톱포인트 설정, 주요 사건에 대한 주의와 같은 조치를 통해 줄일 수 있습니다.
최적화 방향
- 다양한 둥 통로 주기 변수 조합을 테스트한다
- 변동율 변수를 최적화하여 최적의 출입 시점을 찾아내기
- 트렌드를 판단하는 지표를 추가하고 역동적인 거래를 피하십시오.
- 주식 기본 선택 지표와 결합된
- 손실을 막기 위한 조정
요약하다
쌍둥이 통로 돌파 전략은 전체적으로 비교적 안정적이고 신뢰할 수 있는 트렌드 추적 전략이다. 그것은 동시에 트렌드 캡처 및 위험 제어의 장점을 갖추고 있으며, 여러 종류의 주식 거래 전략에 적합한 기본 모듈이다. 매개 변수 최적화 및 규칙 개선을 통해 전략의 효과를 더욱 향상시킬 수 있다.
/*backtest
start: 2024-01-04 00:00:00
end: 2024-02-03 00:00:00
period: 1h
basePeriod: 15m
exchanges: [{"eid":"Futures_Binance","currency":"BTC_USDT"}]
*/

// This Pine Script™ code is subject to the terms of the Mozilla Public License 2.0 at https://mozilla.org/MPL/2.0/
// © omererkan

//@version=5
strategy(title="Double Donchian Channel Breakout", overlay=true, initial_capital = 1000, commission_value = 0.05, default_qty_value = 100, default_qty_type = strategy.percent_of_equity)


slowLen = input.int(50, title="Slow Donchian")
fastLen = input.int(30, title="Fast Donchian")
volatility = input.int(3, title="Volatility (%)")
longProfitPerc = input.float(2, title="Long TP1 (%)", minval=0.0, step=0.1) * 0.01
shortProfitPerc = input.float(2, title="Short TP1 (%)", minval=0.0, step=0.1) * 0.01
TP1Yuzde =input.int(50, title = "TP1 Position Amount (%)")

ubSlow = ta.highest(close, slowLen)[1]
lbSlow = ta.lowest(close, slowLen)[1]

ubFast = ta.highest(close, fastLen)[1]
lbFast = ta.lowest(close, fastLen)[1]

plot(ubSlow, color=color.green, linewidth=2, title="Slow DoCh - Upperband")
plot(lbSlow, color=color.green, linewidth=2, title="Slow DoCh - Lowerband")
plot(ubFast, color=color.blue, linewidth=2, title="Fast DoCh - Upperband")
plot(lbFast, color=color.blue, linewidth=2, title="Fast DoCh - Lowerband")

fark = (ubSlow - lbSlow) / lbSlow * 100

longExitPrice  = strategy.position_avg_price * (1 + longProfitPerc)
shortExitPrice = strategy.position_avg_price * (1 - shortProfitPerc)

longCondition = ta.crossover(close, ubSlow) and fark > volatility
if (longCondition)
    strategy.entry("Long", strategy.long)

shortCondition = ta.crossunder(close, lbSlow) and fark > volatility
if (shortCondition)
    strategy.entry("Short", strategy.short)

if strategy.position_size > 0 and ta.crossunder(close, lbFast)
    strategy.close("Long", "Close All")

if strategy.position_size < 0 and ta.crossover(close, ubFast)
    strategy.close("Short", "Close All")

// Take Profit
if strategy.position_size > 0
    strategy.exit("TP1", "Long", qty_percent = TP1Yuzde, limit = longExitPrice)

if strategy.position_size < 0
    strategy.exit("TP1", "Short", qty_percent = TP1Yuzde, limit = shortExitPrice)