개요
트렌드 추적 이동 평균 전략은 장기 이동 평균을 기반으로 트렌드 방향을 식별하고, 평균 실제 이동 범위를 필터링하는 잘못된 행태를 결합한 트렌드 추적 전략이다. 이 전략은 지수 이동 평균을 사용하여 트렌드 방향을 판단하고, 평균 실제 이동 범위를 사용하여 가짜 돌파구로 식별되는지 여부를 판단한다. 이것은 충격적인 행태를 효과적으로 필터링하여 전략의 전반적인 회전을 줄일 수 있다.
전략 원칙
이 전략은 다음과 같은 원칙을 바탕으로 설계되었습니다.
- 지수 이동 평균을 사용하여 전체 경향 방향을 판단하십시오. 주기 길이는 200 K 선을 기본으로합니다.
- 최근 10개의 K선들의 평균 실제 변동 범위를 계산한다.
- 마감 가격이 이동 평균 + 평균 실제 변동 범위보다 높을 때 상승 추세로 판단한다.
- 마감값이 수 이동 평균 - 평균 실제 변동 범위 수보다 낮을 때, 하향 추세로 판단한다.
- 상승 추세에서는 더 많은 것을 하고, 하락 추세에서는 더 많은 것을 하지 않는다.
- 기본 정책은 이동 평균으로 스톱 라인을 이동 평균 역행± 평균 실제 변동 범위로 스톱 라인을 선택 할 수 있습니다.
우위 분석
이 전략은 다음과 같은 장점을 가지고 있습니다.
- 이동 평균을 사용하여 큰 트렌드를 판단하여 단기 시장 소음을 효과적으로 필터링 할 수 있습니다.
- 평균 실제 변동 범위를 필터링 조건으로 추가하여 불안정한 상황에서 거래 신호를 생성하는 것을 방지하고 불필요한 손실을 줄일 수 있습니다.
- 스톱 라인은 이동 평균 또는 그 반전 범위에 가깝고, 빠른 스톱으로 최대 회수를 줄일 수 있다.
- 간단한 파라미터 설정, 이해하기 쉽고 조정하기 쉽다.
위험 분석
이 전략에는 몇 가지 잠재적인 위험도 있습니다.
- 평선 시스템에서는, 트렌드가 반전될 때 어느 정도 회전이 발생한다.
- 이동 평균과 평균 실제 변동 범위의 파라미터를 설정하면 전략의 성과에 큰 영향을 미칩니다. 잘못 설정하면 거래 기회를 놓치거나 불필요한 손실을 증가시킬 수 있습니다.
- 전략 자체는 주가와 거래량 사이의 관계를 고려하지 않습니다. 잘못된 신호가 발생할 수 있습니다.
최적화 방향
이 전략은 다음과 같은 부분에서 최적화될 수 있습니다.
- 다른 종류의 이동 평균을 테스트하여 특정 주식이나 품종에 가장 적합한 이동 평균 파라미터를 찾습니다.
- 이동 평균의 주기 변수를 최적화하여 거래되는 주식이나 품종의 특성에 더 적합하게 만듭니다.
- 평균 실제 변동 범위의 변수를 최적화하여 최적의 변수 조합을 찾아 흐름을 놓치지 않고 흔들림을 필터링하십시오.
- 거래량을 판단하는 규칙을 늘리고, 무효적인 돌파구를 피한다.
- 다른 손해 방지 방법을 테스트하고 비교하여 최적의 방법을 결정합니다.
요약하다
트렌드 추적 이동 평균 전략은 전체적으로 매우 간단하고 실용적인 트렌드 전략이다. 동시에 좋은 위험 관리 효과가 있다. 비록 전략은 많은 요소를 고려하지 않고, 여전히 파라미터와 스톱 라인을 세심하게 테스트하고 최적화해야하지만, 전체적으로 쉽게 습득하고 조정할 수 있는 효과적인 전략이다. 그것의 간단한 거래 논리와 파라미터 설정은 다양한 품종에 널리 적용될 수 있으며, 특히 비트코인 같은 디지털 통화 거래에 적합하다.
전략 소스 코드
/*backtest
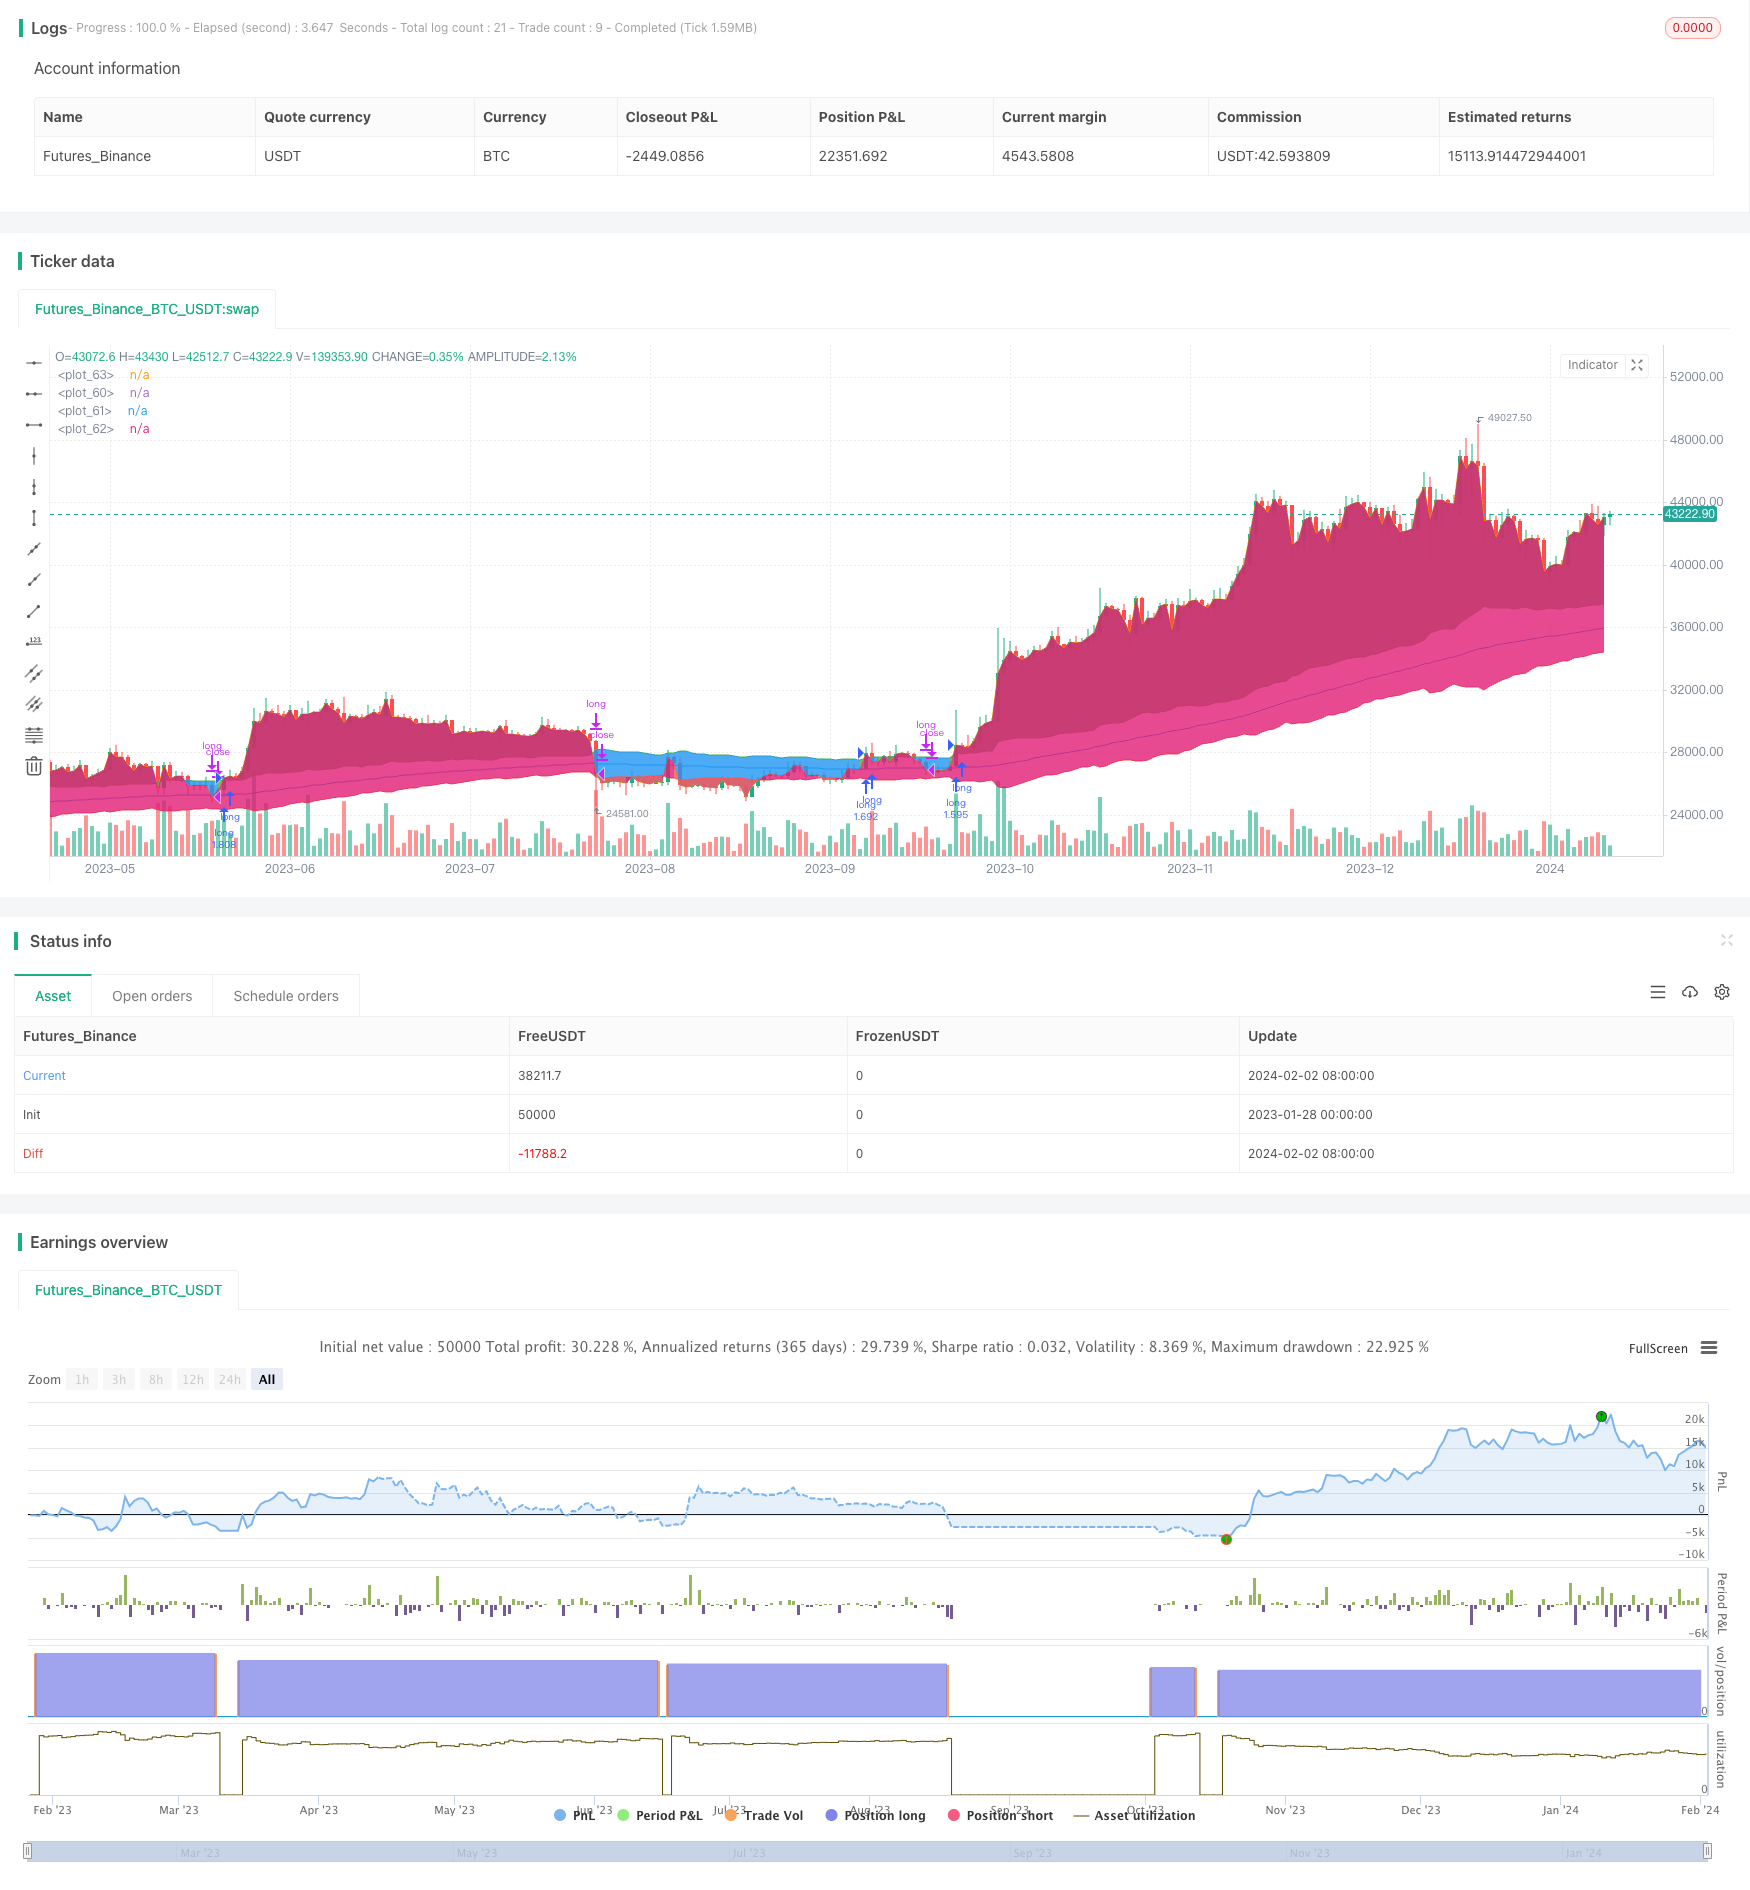
start: 2023-01-28 00:00:00
end: 2024-02-03 00:00:00
period: 1d
basePeriod: 1h
exchanges: [{"eid":"Futures_Binance","currency":"BTC_USDT"}]
*/
// This source code is subject to the terms of the Mozilla Public License 2.0 at https://mozilla.org/MPL/2.0/
// © Inkedlau
//@version=5
strategy('Swing Trend Strategy', overlay=true, pyramiding=1, default_qty_type=strategy.percent_of_equity, default_qty_value=100, initial_capital=1000, commission_value=0.1)
use_short = input.bool(false, 'Open Short Positions?')
exit_type = input.bool(true, 'Exit trade on Moving Average Cross?')
src = input.source(close, 'Source')
len = input.int(200, 'Trend Length')
ma_type = input.string('ema', 'Moving Average Type', options=['sma', 'ema', 'rma', 'wma', 'vwma'], tooltip='Select the type of Moving Average to use to calculate the Trend')
atr_multiplier = input.float(1., 'ATR Threshold', step=0.5, tooltip='Filter the ranging market using the Average True Range')
// ----------------------- DESCRIPTION -----------------------
// THIS SCRIPT IS A TREND FOLLOWING SYSTEM THAT USES A COMBINATION OF MOVING AVERAGE AND AVERAGE TRUE RANGE
// TO SPOT THE TRENDS AND ENTER THE MARKET ACCODINGLY.
// THE MARKET IS CONSIDERED IN AN UPTREND WHEN THE PRICE CLOSES ABOVE THE MOVING AVERAGE + THE AVERAGE TRUE RANGE OF THE LAST 10 PERIODS
// THE MARKET IS CONSIDERED IN AN DOWNTREND WHEN THE PRICE CLOSES BLOW THE MOVING AVERAGE - THE AVERAGE TRUE RANGE OF THE LAST 10 PERIODS
// BY DEFAULT, THE STRATEGY WILL ENTER LONG WHEN AN UPTREND IS SPOTTED, THEN CLOSES WHEN THE PRICE CLOSES BELOW THE MOVING AVERAGE
// THE STRATEGY WILL ENTER SHORT WHEN A DOWNTREND IS SPOTTED, THEN CLOSES WHEN THE PRICE CLOSES ABOVE THE MOVING AVERAGE
// ------------------ INDICATORS CALCULATION------------------
my_ma()=>
ma = close
if ma_type == 'sma'
ma := ta.sma(src, len)
if ma_type == 'ema'
ma := ta.ema(src, len)
if ma_type == 'rma'
ma := ta.rma(src, len)
if ma_type == 'wma'
ma := ta.wma(src, len)
if ma_type == 'vwma'
ma := ta.vwma(src, len)
ma
trend = my_ma()
atr = ta.atr(10)
uptrend = trend + atr * atr_multiplier
downtrend = trend - atr * atr_multiplier
// ---------------- ENTRY AND EXIT CONDITIONS ----------------
open_long = strategy.position_size == 0 and src > uptrend
close_long = exit_type ? strategy.position_size > 0 and src < trend : strategy.position_size > 0 and src < downtrend
open_short = use_short and strategy.position_size == 0 and src < downtrend
close_short = exit_type ? strategy.position_size < 0 and src > trend : strategy.position_size < 0 and src > uptrend
strategy.entry('long', strategy.long, when=open_long)
strategy.close('long', when=close_long)
strategy.entry('short', strategy.short, when=open_short)
strategy.close('short', when=close_short)
// ------------------ PLOTTING AND COLORING ------------------
tcolor = src > uptrend ? color.green : src < downtrend ? color.red : na
ptrend = plot(trend, color=color.blue, linewidth=1)
puptrend = plot(uptrend, color=color.green, linewidth=1)
pdowntrend = plot(downtrend, color=color.red, linewidth=1)
pclose = plot(close, color=na)
fill(puptrend, pclose, color=close > uptrend ? color.green : na, transp = 90)
fill(pdowntrend, pclose, color=close < downtrend ? color.red : na, transp = 90)