동적 RSI 지표 거래 전략

개요
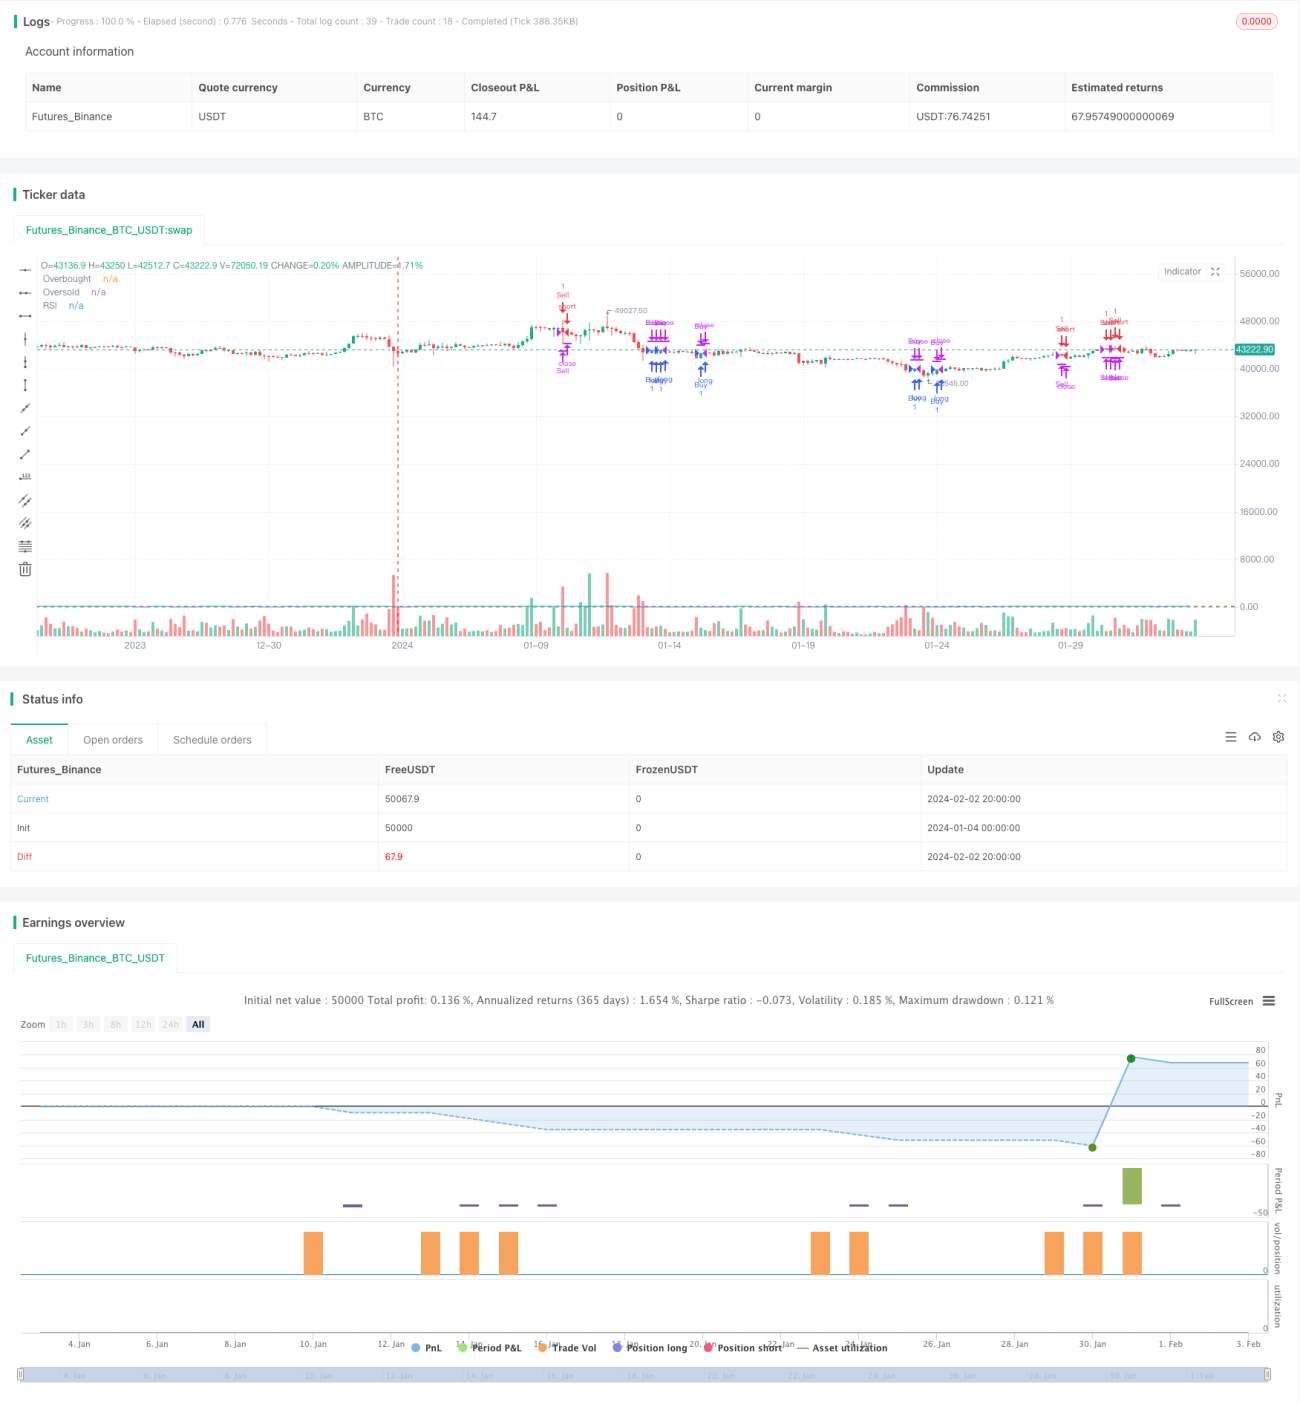
이 전략은 RSI 지표를 계산하고 오버로 오버로 범위를 설정하여 동적인 스톱로스와 목표 수익을 복귀시켜 거래 전략을 구축합니다. RSI 지표 상의 오버로스를 통과 할 때 공백을 만들고 오버로스를 통과 할 때 더 많이 만들며, 트래킹 스톱로스와 목표 수익을 설정하여 포지션을 종료합니다.
전략 원칙
이 전략은 14일 RSI 지표를 사용하여 시장의 기술적 형태를 판단한다. RSI 지표는 시장이 과매매되거나 과매매되는지를 판단하기 위해 일정 기간 동안의 상승과 하락의 동력의 비율을 반영한다. 이 전략의 RSI 길이는 14이다.
또한, 이 전략은 동적 추적 손실 메커니즘을 사용합니다. 다중 상위 포지션을 보유 할 때, 폐쇄 가격의 97%를 위해 중지 손실을 추적합니다. 빈 상위 포지션을 보유 할 때, 폐쇄 가격의 103%를 위해 중지 손실을 추적합니다.
마지막으로, 이 전략은 또한 목표 수익 메커니즘을 사용합니다. 지분 수익률이 20%에 도달하면 포지션에서 탈퇴합니다. 이것은 수익의 일부를 잠금하여 수익의 회귀를 방지 할 수 있습니다.
우위 분석
이 전략에는 다음과 같은 장점이 있습니다.
- RSI를 사용하여 과매매를 판단하여 시장의 전환점을 신속하게 파악할 수 있습니다.
- 다이내믹 트래킹 스톱로스 (Dynamic Tracking Stop Loss) 를 적용하여 위험을 효과적으로 제어할 수 있습니다.
- 목표 수익 수준을 설정하여 수익의 일부를 잠금할 수 있습니다.
- 전략이 명확하고 이해하기 쉽다, 매개 변수가 적고, 실 디스크 동작이 용이하다
- RSI의 길이를 최적화할 수 있습니다.
위험 분석
이 전략에는 몇 가지 위험도 있습니다.
- RSI 지표가 부적절한 손실을 초래할 수 있는 가짜 신호를 내놓을 가능성
- 이 경우, 손실을 확대할 수 있는 확률이 있습니다.
- 목표 수익이 너무 낮아서 포지션이 충분히 수익을 내지 못하는 경우
위와 같은 위험은 RSI 파라미터를 최적화하고, 스톱 스피드를 조정하고, 목표 수익 요구 사항을 적절하게 완화하여 해결할 수 있습니다.
최적화 방향
이 전략은 다음과 같은 방향으로 최적화될 수 있습니다.
- RSI 지표 변수를 최적화하고, 과매매 판단 기준을 조정하고, 가짜 신호의 가능성을 감소시킵니다.
- 다른 지표에 필터를 추가하여 RSI가 한 번에 잘못된 신호를 발생하지 않도록하십시오.
- 동적으로 목표 수익 수준을 최적화하여 시장 상황에 따라 전략을 유연하게 조정합니다.
- 거래량 지표와 결합하여 낮은 거래량 가짜 돌파구를 피하십시오.
- 기계 학습 알고리즘을 추가하고, 자동으로 파라미터를 최적화합니다.
요약하다
이 전략의 전체적인 생각은 명확하고, RSI 지표를 사용하여 과매매를 판단하고, 동적 스톱로스와 목표 수익 철수를 지원한다. 이점은 구현을 이해하기 쉽고, 위험을 통제하고, 확장성이 강하다. 다음 단계는 신호 품질, 동적 조정 파라미터 등을 향상시키는 방향으로 최적화 할 수 있으며, 전략을 더 지능화한다.
- 1