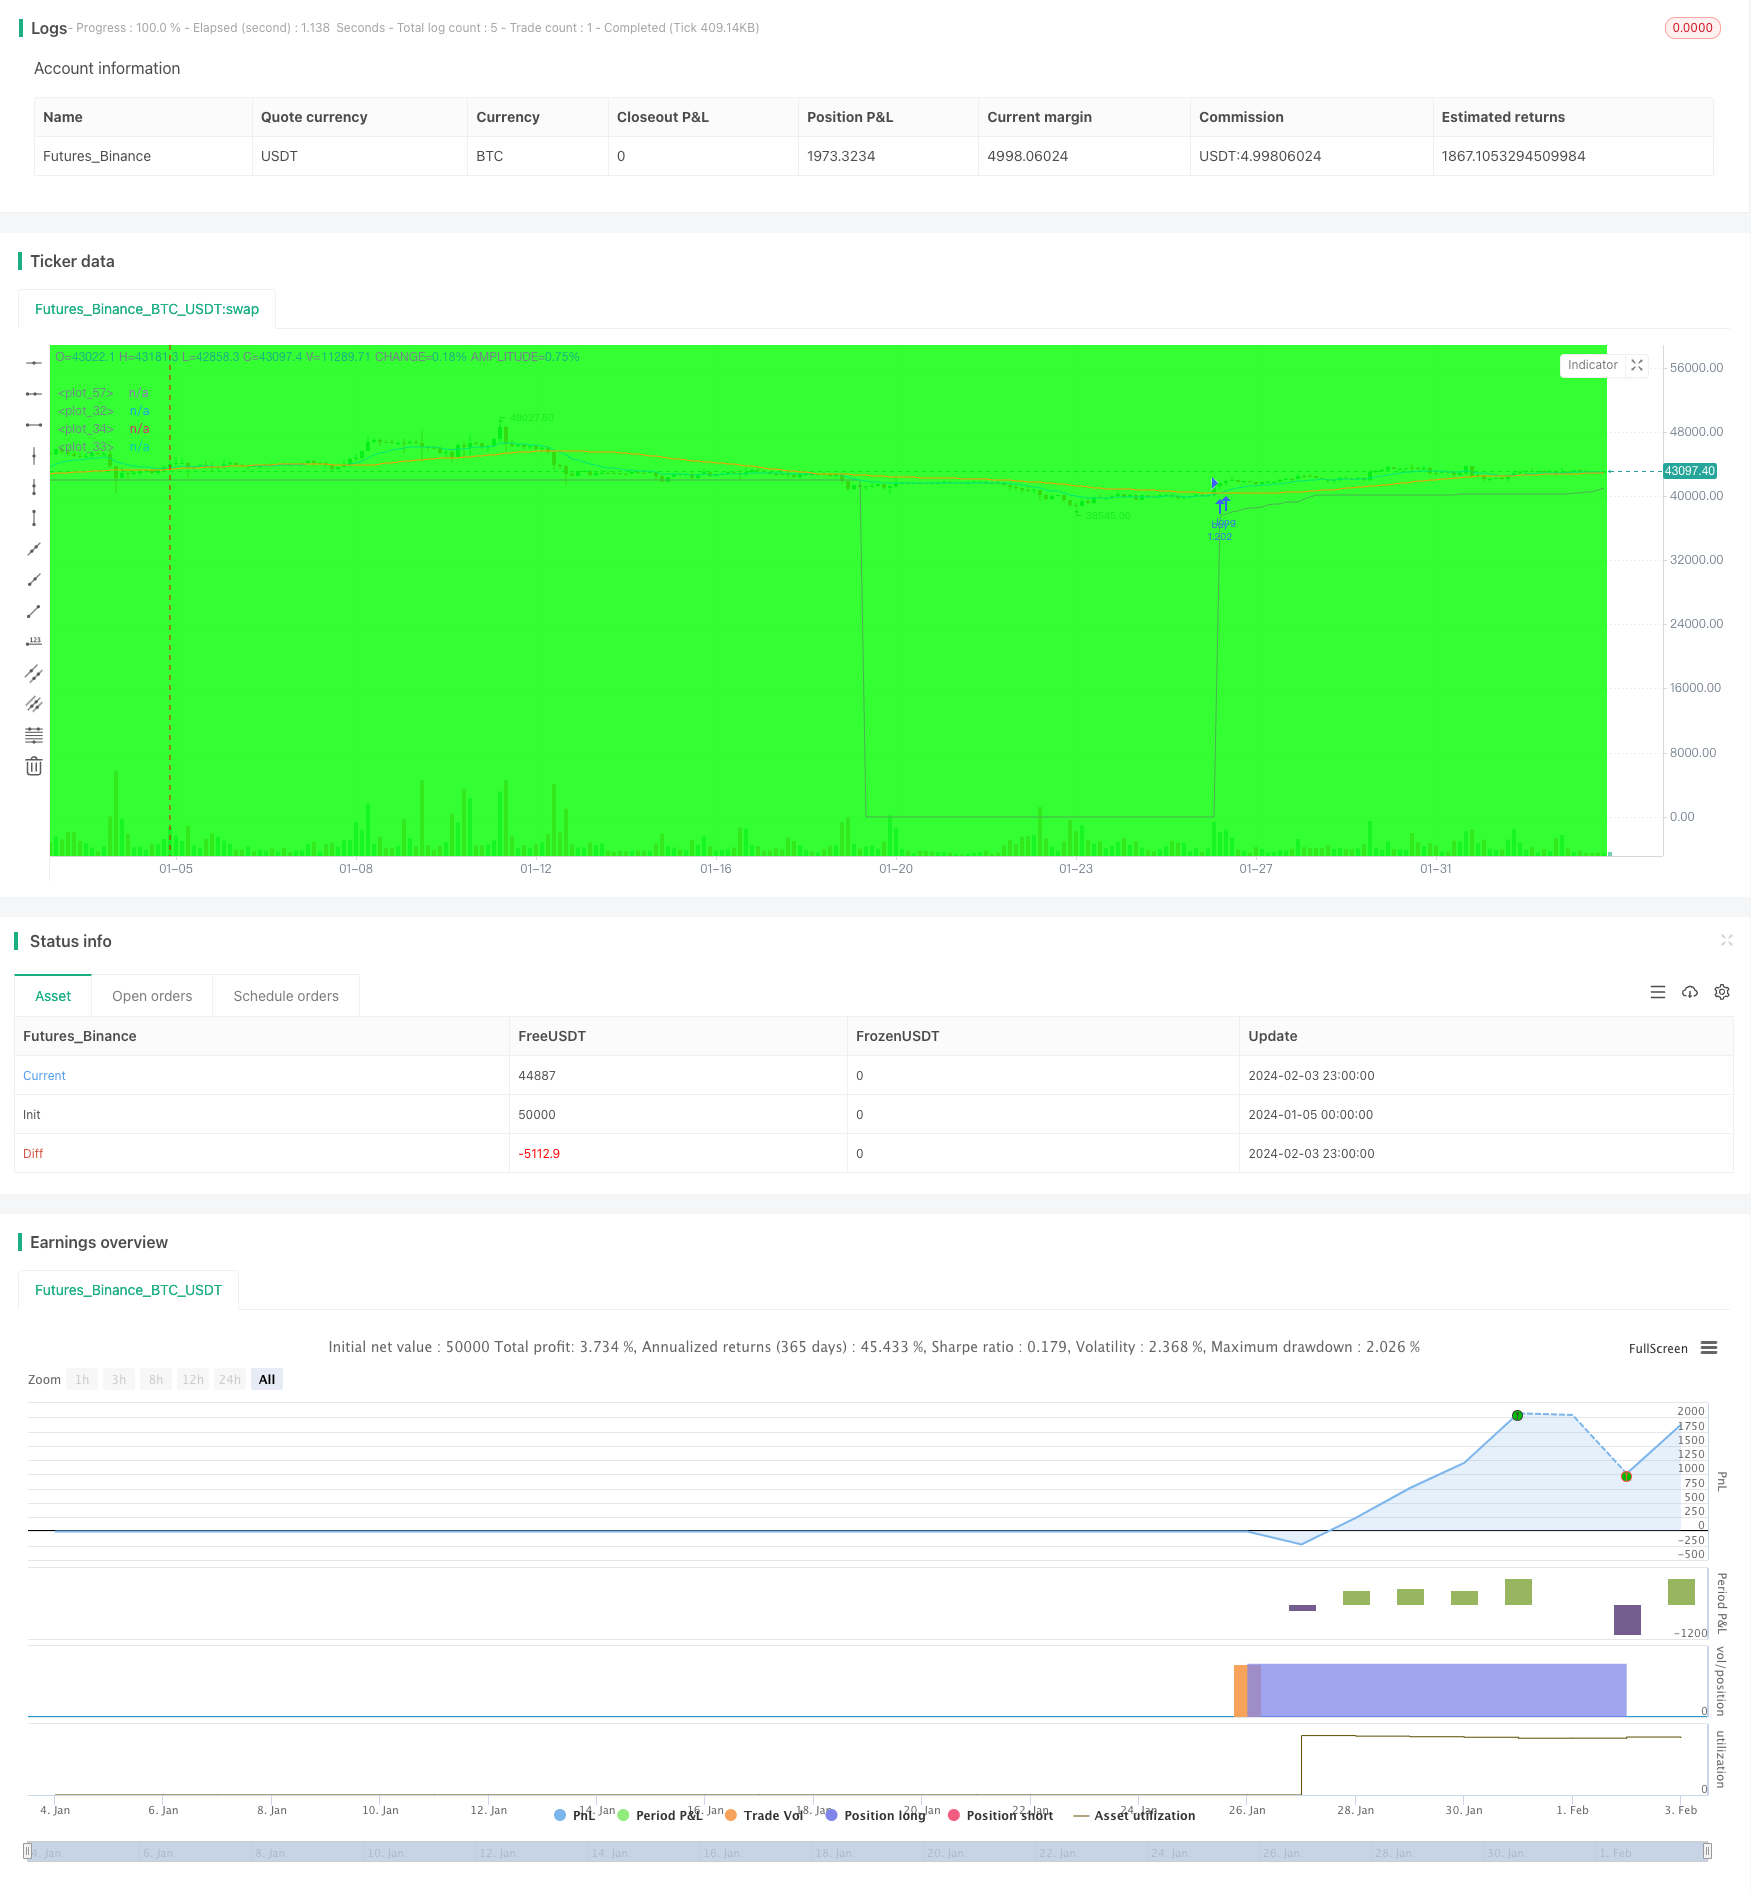
개요
이 전략은 두 가지 다른 변수의 이동 평균을 계산하여, 빠른 선에서 느린 선을 통과 할 때 구매 신호를 생성한다. 동시에 평균 실제 변동 범위를 계산하여 중지 가격을 추적하고, 가격이 그 중지 가격 아래로 떨어지면 판매 신호를 생성한다. 이 전략은 시장 추세를 효과적으로 추적하고, 이윤을 얻은 후 적시에 중지한다.
전략 원칙
- 빠른 이동 평균 ((EMA): 매개 변수는 12일 지수 이동 평균으로, 가격 변화에 신속하게 반응할 수 있다.
- 느린 이동 평균 ((SMA): 변수는 45일 간단한 이동 평균으로, 중장기 경향을 나타낸다.
- 빠른 이동 평균에서 느린 이동 평균을 통과하면 구매 신호가 발생한다.
- 15일 평균 실제 변동량 (ATR) 을 스톱로즈 기준으로 계산한다.
- ATR 값에 따라 트래킹 스톱 로드 폭을 설정합니다 (예: 6배의 ATR) 그리고 실시간으로 스톱 로드 가격을 업데이트합니다.
- 가격이 스톱로스 가격보다 낮으면 판매 신호를 냅니다.
이 전략은 트렌드 추적과 스톱 관리의 장점을 결합하여 중장선 방향을 추적 할 수 있으며, 스톱을 통해 단독 손실을 제어 할 수 있습니다.
우위 분석
- 이동 평균 조합은 트렌드를 효과적으로 식별하여 신호의 신뢰성을 증가시킵니다.
- 동적으로 추적된 상쇄는 상쇄를 적시에 방지하고, 금융력을 공격하는 것을 방지한다.
- ATR을 결합한 스톱은 스톱 가격을 합리화하고 과도한 감수성을 방지한다.
- 전략이 명확하고 이해가 쉬우며, 매개 변수가 유연하게 조정된다.
위험 분석
- 이동 평균이 지연되어 단선 기회를 놓칠 수 있습니다.
- 하지만, 이 경우에도 이자율이 낮아질 수 있습니다.
- 너무 민감한 차단은 거래 빈도와 수수료 부담을 증가시킬 수 있습니다.
- 주식 변동율의 변화는 ATR 변수의 안정성에 영향을 줄 수 있다.
이동 평균 파라미터를 적절히 최적화하거나, ATR 배수를 조정하여 스톱 로스를 균형을 잡을 수 있다. 또한 다른 지표와 결합하여 엔트리 타이밍을 개선하기 위해 필터링 조건으로 사용할 수 있다.
최적화 방향
- 더 많은 변수 조합을 테스트하여 최적의 이동 평균을 선택하십시오.
- 다른 주식의 특성에 따라 ATR 중지 손실의 배수 변수를 조정하십시오.
- 수량 가격 지표와 같은 필터링 조건을 추가하여 불필요한 거래를 피하십시오.
- 더 많은 역사 데이터 테스트를 축적하여 변수의 안정성을 검증하십시오.
요약하다
이 전략은 성공적으로 이동 평균의 트렌드 추적과 ATR 동적 상쇄를 결합하고, 변수 최적화를 통해 다른 주식 특성에 적응할 수 있습니다. 이 전략은 명확한 구매 제한 경계와 중지 제한 경계를 형성하여 거래 논리가 간단하고 명확합니다. 전반적으로 이 쌍 이동 평균 추적 상쇄 전략은 안정적이고 간단하며 최적화하기 쉽고 주식 거래의 기본 전략에 적합합니다.
전략 소스 코드
/*backtest
start: 2024-01-05 00:00:00
end: 2024-02-04 00:00:00
period: 3h
basePeriod: 15m
exchanges: [{"eid":"Futures_Binance","currency":"BTC_USDT"}]
*/

//@version=2
//created by XPloRR 24-02-2018

strategy("XPloRR MA-Buy ATR-MA-Trailing-Stop Strategy",overlay=true, initial_capital=1000,default_qty_type=strategy.percent_of_equity,default_qty_value=100)

testStartYear = input(2005, "Start Year")
testStartMonth = input(1, "Start Month")
testStartDay = input(1, "Start Day")
testPeriodStart = timestamp(testStartYear,testStartMonth,testStartDay,0,0)

testStopYear = input(2050, "Stop Year")
testStopMonth = input(12, "Stop Month")
testStopDay = input(31, "Stop Day")
testPeriodStop = timestamp(testStopYear,testStopMonth,testStopDay,0,0)

testPeriodBackground = input(title="Background", type=bool, defval=true)
testPeriodBackgroundColor = testPeriodBackground and (time >= testPeriodStart) and (time <= testPeriodStop) ? #00FF00 : na
bgcolor(testPeriodBackgroundColor, transp=97)

emaPeriod = input(12, "Exponential MA")
smaPeriod = input(45, "Simple MA")
stopPeriod = input(12, "Stop EMA")
delta = input(6, "Trailing Stop #ATR")

testPeriod() => true

emaval=ema(close,emaPeriod)
smaval=sma(close,smaPeriod)
stopval=ema(close,stopPeriod)
atr=sma((high-low),15)

plot(emaval, color=blue,linewidth=1)
plot(smaval, color=orange,linewidth=1)
plot(stopval, color=lime,linewidth=1)

long=crossover(emaval,smaval)
short=crossunder(emaval,smaval)

//buy-sell signal
stop=0
inlong=0
if testPeriod()
    if (long and (not inlong[1]))
        strategy.entry("buy",strategy.long)
        inlong:=1
        stop:=emaval-delta*atr
    else
        stop:=iff((nz(emaval)>(nz(stop[1])+delta*atr))and(inlong[1]),emaval-delta*atr,nz(stop[1]))
        inlong:=nz(inlong[1])
        if ((stopval<stop) and (inlong[1]))
            strategy.close("buy")
            inlong:=0
            stop:=0
else
    inlong:=0
    stop:=0
plot(stop,color=green,linewidth=1)