개요
이 전략은 3개의 다른 주기의 EMA 평균을 기반으로, 가격이 EMA 평균 위에 있는지 여부를 판단하여 현재의 트렌드 방향을 판단한다. 짧은 EMA 라인을 가로질러 긴 EMA 라인을 가로질러 구매 신호를 생성한다. 짧은 EMA 라인을 가로질러 긴 EMA 라인을 가로질러 판매 신호를 생성한다. 이 전략은 트렌드를 추적하고, 트렌드가 변할 때 적시에 평점한다.
전략 원칙
이 전략은 3개의 EMA 평균을 사용한다. 각각 10일선, 20일선, 그리고 50일선이다.
10일 EMA와 20일 EMA가 동시에 50일 EMA 위에 있을 때 상승 트렌드로 정의됩니다.
10일 EMA와 20일 EMA가 동시에 50일 EMA 밑에 있을 때, 하향 경향으로 정의됩니다.
단기 EMA 라인 (10일 라인 및 20일 라인) 에 장기 EMA 라인 (50일 라인) 을 뚫을 때 구매 신호를 생성합니다.
단기 EMA 라인 (10일 라인 및 20일 라인) 아래에서 장기 EMA 라인 (50일 라인) 을 통과할 때 판매 신호를 생성한다.
상승 추세에서 다수 상위 포지션을, 하향 추세에서 공백 포지션을 보유;
트렌드가 변할 때, EMA 단선과 장기선이 뚫어지는 것을 볼 수 있습니다.
이 전략은 Capture Profit을 통해, 적시 평점으로 수익을 잠금하는 방식으로 차례로 다중공영을 한다.
우위 분석
이 전략은 다음과 같은 장점을 가지고 있습니다.
- 규칙은 간단하고 명확하며, 이해하기 쉽고 실행이 가능합니다.
- EMA 평균을 사용하여 트렌드 방향을 판단하여 시장의 단기 변동에 방해받지 않도록하십시오.
- 적자를 적시하고, 추세를 추적하고, 손실을 막기 위해
- 트렌드를 따라가며, 높은 승률을 기록할 수 있습니다.
위험 분석
이 전략에는 몇 가지 위험도 있습니다.
- 시장을 정리할 때, EMA 평균 사이에는 여러 번의 침투가 발생할 수 있으며, 빈번하게 입장을 닫는 것은 거래 비용을 초래할 수 있습니다.
- 거래가 하락하면 EMA의 추세 판단의 효과에 영향을 미치며, 좋은 포지션 개시 기회를 놓칠 수 있다.
위와 같은 위험은 다음과 같은 방법으로 최적화할 수 있습니다.
- EMA 간격이 작을 때 포지션 개설 규칙을 적절히 완화하여 너무 자주 거래되는 것을 피할 수 있습니다.
- 다른 지표와 결합하여 트렌드를 파악하여 EMA가 무효로 판단하는 상황을 피하십시오.
최적화 방향
이 전략은 다음과 같은 방향으로 최적화될 수 있습니다.
매개 변수 최적화. 다양한 EMA 주기에서 매개 변수 조합을 테스트하여 최적의 매개 변수를 찾을 수 있다.
거래비용 최적화. 포지션 개설 규칙을 적절히 최적화하여 불필요한 거래 빈도를 줄여주기.
손해 차단 전략 최적화. 합리적인 손해 차단 수준을 설정하고 단독 손실을 제어합니다.
다른 지표와 결합하여. MACD, KDJ 등 다른 지표의 보조 판단을 사용하여 입학 시간을 최적화하십시오.
요약하다
이 전략은 전체적으로 비교적 간단하고 실용적입니다. 그것은 EMA를 사용하여 트렌드 운행 방향을 판단하고, 적절한 중지 전략을 수반하여 위험을 효과적으로 제어 할 수 있습니다. 또한, 몇 가지 최적화 공간이 있습니다. 변수 최적화, 중지 전략, 기타 지표와 결합하면 이 전략의 효과는 큰 향상 공간을 가지고 있습니다.
/*backtest
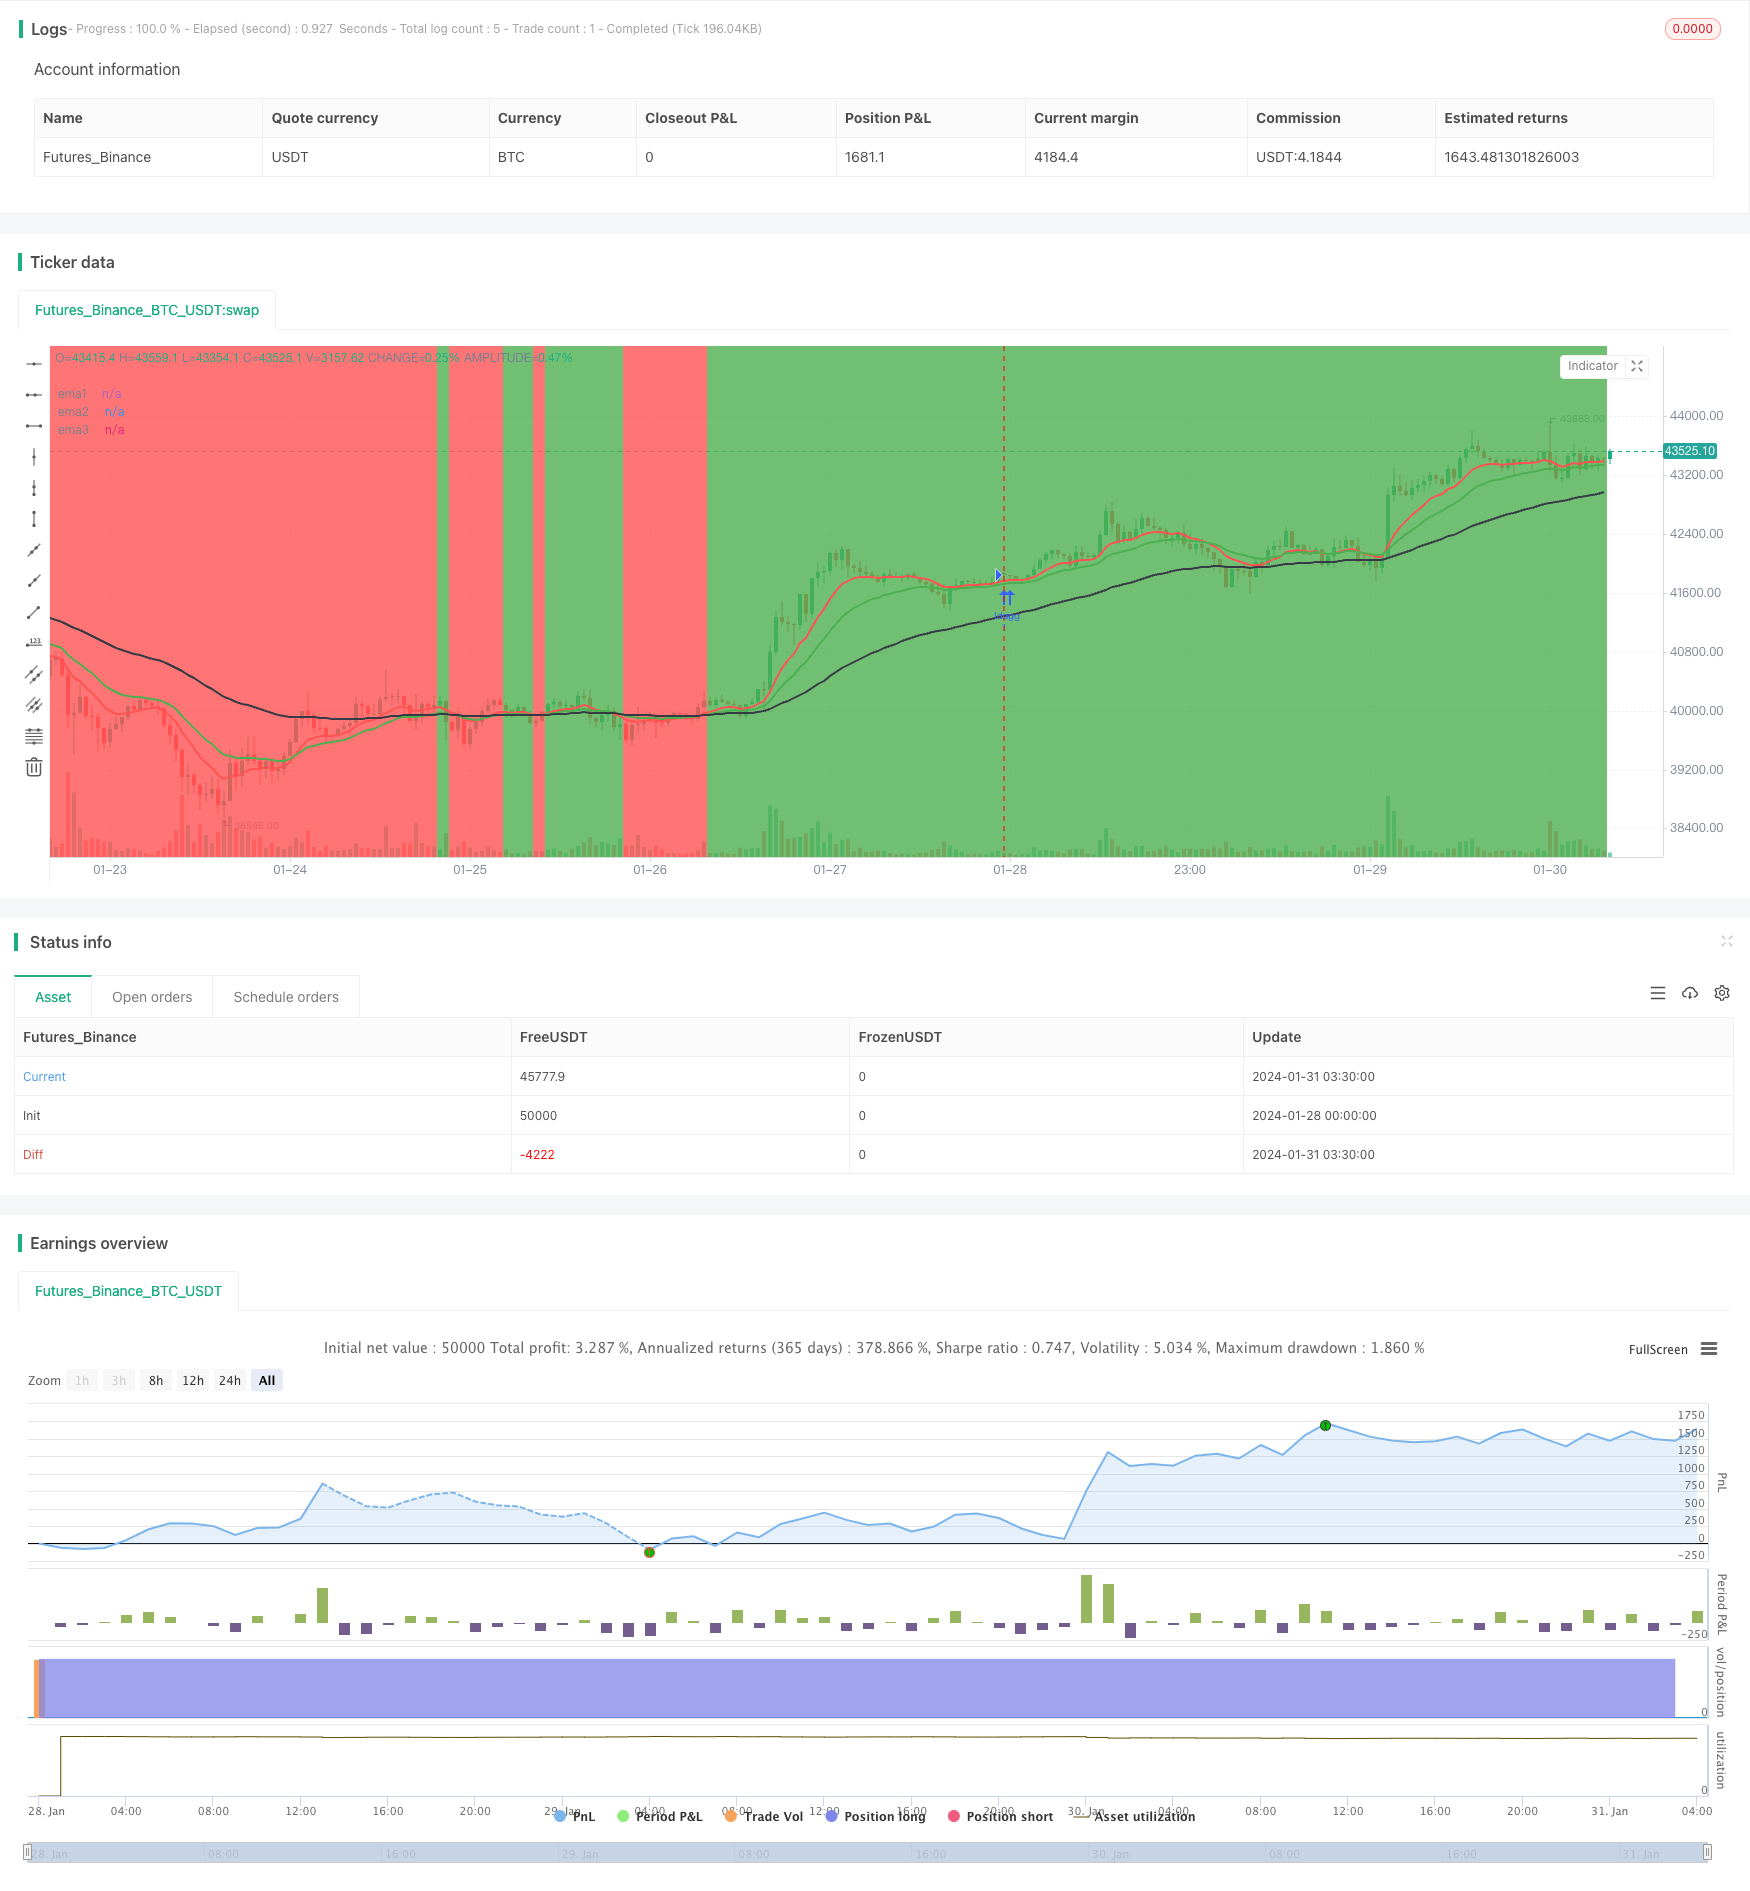
start: 2024-01-28 00:00:00
end: 2024-01-31 04:00:00
period: 45m
basePeriod: 5m
exchanges: [{"eid":"Futures_Binance","currency":"BTC_USDT"}]
*/
// This source code is subject to the terms of the Mozilla Public License 2.0 at https://mozilla.org/MPL/2.0/
// © mattehalen
//@version=4
//study("EMA 10,20 59",overlay=true)
strategy("EMA 10,20 59",overlay=true)
infoBox = input(true, title="infoBox", type=input.bool)
infoBox2 = input(false, title="infoBox2", type=input.bool)
BuySellSignal_Bool = input(false, title="Buy & SellSignal", type=input.bool)
infoBoxSize = input(title="infoBoxSize", defval=size.large, options=[size.auto, size.tiny, size.small, size.normal, size.large, size.huge])
ema1Value = input(10)
ema2Value = input(20)
ema3Value = input(59)
maxLoss = input(3000)
ema1 = ema(close,ema1Value)
ema2 = ema(close,ema2Value)
ema3 = ema(close,ema3Value)
objcnt = 0
buyTitle = tostring(close[1])
myProfit = float(0)
plot(ema1,title="ema1",color=color.red,linewidth=2)
plot(ema2,title="ema2",color=color.green,linewidth=2)
plot(ema3,title="ema3",color=color.black,linewidth=2)
Buytrend = (ema1 and ema2 > ema3) and (ema1[1] and ema2[1] > ema3[1])
BarssinceBuyTrend = barssince(Buytrend)
BarssinceSellTrend = barssince(not Buytrend)
closeAtBuyTrend = close[1]
bgcolor(Buytrend ? color.green : color.red,transp=70)
BuySignal = Buytrend and not Buytrend[1] and BuySellSignal_Bool
BuySignalOut = Buytrend and (crossunder(ema1,ema2)) and BuySellSignal_Bool
BarssinceBuy = barssince(BuySignal)
bgcolor(BuySignal ? color.green : na , transp=30)
bgcolor(BuySignalOut ? color.black : na , transp=30)
plot(BarssinceBuy,title="BarssinceBuy",display=display.none)
SellSignal = not Buytrend and Buytrend[1] and BuySellSignal_Bool
SellSignalOut = not Buytrend and (crossover(ema1,ema2)) and BuySellSignal_Bool
BarssinceSell = barssince(SellSignal)
bgcolor(SellSignal ? color.red : na , transp=30)
bgcolor(SellSignalOut ? color.black : na , transp=30)
plot(BarssinceSell,title="BarssinceSell",display=display.none)
buyProfit = float(0)
cntBuy =0
sellProfit = float(0)
cntSell =0
buyProfit := Buytrend and not Buytrend[1]? nz(buyProfit[1]) + (close[BarssinceBuyTrend[1]]-close) : nz(buyProfit[1])
cntBuy := Buytrend and not Buytrend[1]? nz(cntBuy[1]) + 1: nz(cntBuy[1])
sellProfit := not Buytrend and Buytrend[1]? nz(sellProfit[1]) + (close-close[BarssinceSellTrend[1]]) : nz(sellProfit[1])
cntSell := not Buytrend and Buytrend[1]? nz(cntSell[1]) + 1 : nz(cntSell[1])
totalProfit = buyProfit + sellProfit
// if (Buytrend and not Buytrend[1] and infoBox==true)
// l = label.new(bar_index - (BarssinceBuyTrend[1]/2), na,text="Close = " + tostring(close) + "\n" + "Start = "+tostring(close[BarssinceBuyTrend[1]]) + "\n" + "Profit = "+tostring(close[BarssinceBuyTrend[1]]-close) ,style=label.style_labelup, yloc=yloc.belowbar,color=color.red,size=infoBoxSize)
// if (not Buytrend and Buytrend[1] and infoBox==true)
// l = label.new(bar_index - (BarssinceSellTrend[1]/2), na,text="Close = " + tostring(close) + "\n" + "Start = "+tostring(close[BarssinceSellTrend[1]]) + "\n" + "Profit = "+tostring(close-close[BarssinceSellTrend[1]]) ,style=label.style_labeldown, yloc=yloc.abovebar,color=color.green,size=infoBoxSize)
// if (BuySignalOut and not BuySignalOut[1] and infoBox2==true)
// // l = label.new(bar_index - (BarssinceBuy[0]/2), na,text="Close = " + tostring(close) + "\n" + "Start = "+tostring(close[BarssinceBuy[0]]) + "\n" + "Profit = "+tostring(close-close[BarssinceBuy[0]]) ,style=label.style_labelup, yloc=yloc.belowbar,color=color.purple,size=infoBoxSize
// l = label.new(bar_index, na,text="Close = " + tostring(close) + "\n" + "Start = "+tostring(close[BarssinceBuy[0]]) + "\n" + "Profit = "+tostring(close-close[BarssinceBuy[0]]) ,style=label.style_labelup, yloc=yloc.belowbar,color=color.lime,size=infoBoxSize)
// if (SellSignalOut and not SellSignalOut[1] and infoBox2==true)
// // l = label.new(bar_index - (BarssinceSell[0]/2), na,text="Close = " + tostring(close) + "\n" + "Start = "+tostring(close[BarssinceSell[0]]) + "\n" + "Profit = "+tostring(close[BarssinceSell[0]]-close) ,style=label.style_labeldown, yloc=yloc.abovebar,color=color.purple,size=infoBoxSize)
// l = label.new(bar_index, na,text="Close = " + tostring(close) + "\n" + "Start = "+tostring(close[BarssinceSell[0]]) + "\n" + "Profit = "+tostring(close[BarssinceSell[0]]-close) ,style=label.style_labeldown, yloc=yloc.abovebar,color=color.fuchsia,size=infoBoxSize)
// l2 = label.new(bar_index, na, 'buyProfit in pip = '+tostring(buyProfit)+"\n"+ 'cntBuy = '+tostring(cntBuy) +"\n"+ 'sellProfit in pip = '+tostring(sellProfit)+"\n"+ 'cntSell = '+tostring(cntSell) +"\n"+ 'totalProfit in pip = '+tostring(totalProfit) ,
// color=totalProfit>0 ? color.green : color.red,
// textcolor=color.white,
// style=label.style_labeldown, yloc=yloc.abovebar,
// size=size.large)
// label.delete(l2[1])
//--------------------------------------------------
//--------------------------------------------------
if (Buytrend)
strategy.close("short", comment = "Exit short")
strategy.entry("long", true)
strategy.exit("Max Loss", "long", loss = maxLoss)
//if BuySignalOut
// strategy.close("long", comment = "Exit Long")
if (not Buytrend)
// Enter trade and issue exit order on max loss.
strategy.close("long", comment = "Exit Long")
strategy.entry("short", false)
strategy.exit("Max Loss", "short", loss = maxLoss)
//if SellSignalOut
// Force trade exit.
//strategy.close("short", comment = "Exit short")
//--------------------------------------------------
//--------------------------------------------------
//--------------------------------------------------