카마치라 피벗과 볼린저 밴드를 기반으로 한 양적 전략

1
Follow
1782
Followers
개요
이 전략은 우선 전날의 최고 가격, 최저 가격, 그리고 종결 가격에 따라 카마치라 축점을 계산한다. 그리고 부린 대역 지표와 결합하여 가격을 필터링하고, 가격이 축점을 돌파했을 때 거래 신호를 발생시킨다.
전략 원칙
- 지난 거래일 최고 가격, 최저 가격, 종식 가격을 계산합니다.
- 공식에 따라 카마치라 축축을 계산하여, 상단 H4, H3, H2, H1 및 하단 L1, L2, L3, L4를 포함합니다.
- 20일, 브린이 선로에 올랐고, 내려갔다.
- 가격 상승과 하락에 대해 더 많은 것을 하고 하락에 대해 더 적은 것을 합니다.
- 스톱포인트는 브린 벨트 오프레일 또는 오프레일 근처에 위치한다.
우위 분석
- 카마치라 축은 거래 신호의 신뢰성을 강화하기 위해 여러 핵심 지지 저항 지점을 포함합니다.
- 브린 벨트 지표와 결합하여 가짜 돌파구를 효과적으로 필터링합니다.
- 다중 모음, 거래의 유연성
위험 분석
- 부린 띠 지표 파라미터를 잘못 설정하면 거래 신호 오류가 발생할 수 있습니다.
- 카마치라 축의 핵심 지트는 전 거래일 가격에 의존하며, 하룻밤 동안의 비행에 영향을 받을 수 있습니다.
- 다중 무인 항공기 운영은 손실 위험이 있습니다.
최적화 방향
- 브린 띠 변수를 최적화하여 최적의 변수 조합을 찾습니다.
- 다른 지표와 함께 필터링 가짜 돌파 신호
- 단편적 손실을 줄이기 위한 손실을 막는 전략을 강화
요약하다
이 전략은 카마치라 축축과 브린 벨트 지표를 통합하여 가격이 핵심 지지 저항 지점을 돌파 할 때 거래 신호를 발생시킵니다. 매개 변수 최적화 및 신호 필터링을 통해 전략의 수익률과 안정성을 향상시킬 수 있습니다. 전체적으로 이 전략의 거래 아이디어는 명확하고 작동성이 강하며 실체 검증 가치가 있습니다.
Source
Pine
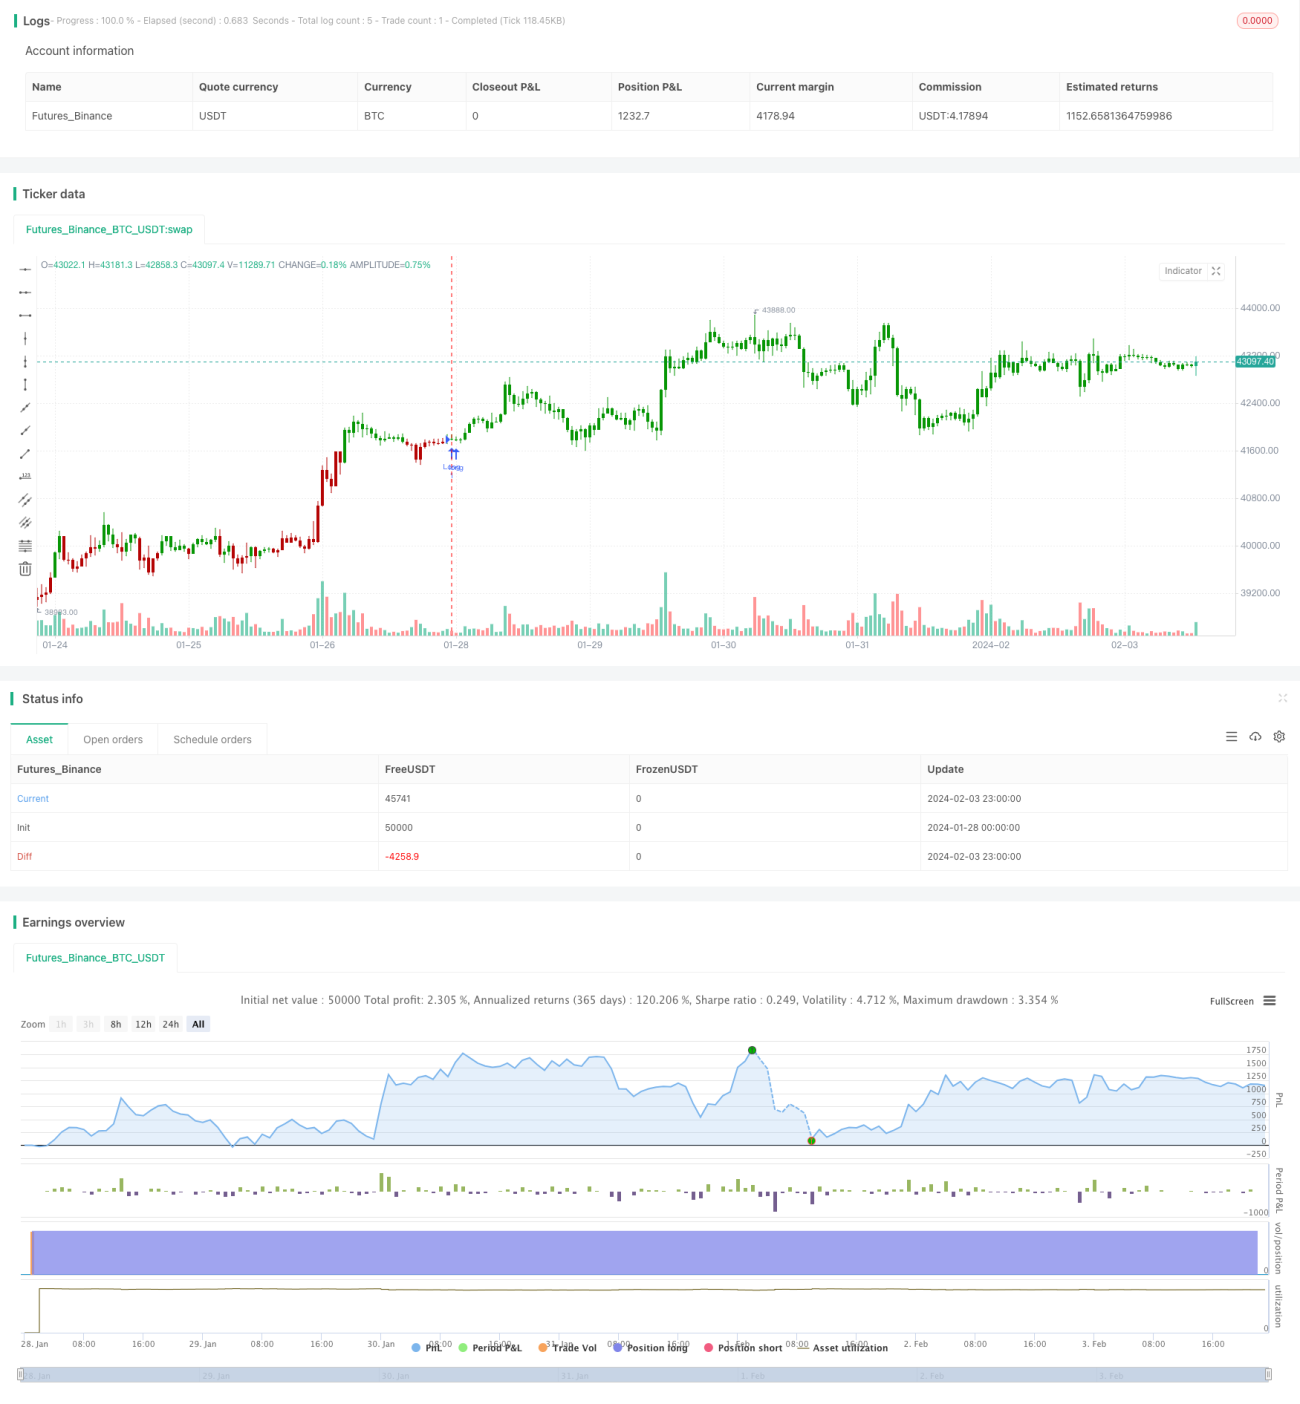
/*backtest
start: 2024-01-28 00:00:00
end: 2024-02-04 00:00:00
period: 1h
basePeriod: 15m
exchanges: [{"eid":"Futures_Binance","currency":"BTC_USDT"}]
*/

//@version=4
////////////////////////////////////////////////////////////
//  Copyright by HPotter v1.0 12/05/2020
// Camarilla pivot point formula is the refined form of existing classic pivot point formula. Strategy parameters
Related strategies
Comment
All comments (0)
No data
- 1