전략 개요
이 전략은 Heikin Ashi 선과 슈퍼 트렌드 지표를 결합한 트렌드 추적 중지 전략이다. Heikin Ashi 선은 시장 소음을 필터링하고, 슈퍼 트렌드 지표를 사용하여 트렌드 방향을 판단하고, 슈퍼 트렌드를 동적인 중지 라인으로 사용하여 효율적인 트렌드 추적 및 위험 관리를 수행한다.
전략 원칙
- 헤이킨 아시 선을 계산합니다. 오픈 가격, 클로즈 가격, 최고 가격, 최저 가격 등이 포함됩니다.
- 슈퍼 트렌드 지표 계산: ATR 및 가격에 따라 오프 레일 및 오브 레일 계산.
- 헤이킨 아시 선과 슈퍼 트렌드를 결합하여 트렌드 방향을 판단한다.
- Heikin Ashi의 종결 가격이 이전 K선 종결 가격보다 슈퍼 트렌드에 더 가깝게 올라가는 궤도를 볼 때 낙점 트렌드; Heikin Ashi의 종결 가격이 이전 K선 종결 가격보다 슈퍼 트렌드에 더 가깝게 내려가는 궤도를 볼 때 낙점 트렌드
- 보이스 트렌드에서는 슈퍼 트렌드 오프레일로 스톱 라인을 추적한다. 보이스 트렌드에서는 슈퍼 트렌드 오프레일로 스톱 라인을 추적한다.
전략적 이점
- Heikin Ashi 필터링을 사용하여 가짜 돌파구를 사용하여 트렌드 신호를 더 신뢰할 수 있습니다.
- 슈퍼 트렌드는 동적 상쇄로, 트렌드 수익을 최대한 고정하고, 너무 큰 회수 회수를 피한다.
- 다른 시간주기를 결합하여 공백을 판단하여 고하위 신호를 확인하는 것이 더 신뢰할 수 있다.
- 특정 시간대의 비이성적인 행동의 영향을 피하기 위해 시시 평점 기능.
전략적 위험
- 트렌드 반전 시에는 손해가 발생하기 쉽다. 이 위험을 줄이기 위해 적절히 느슨한 스톱 라인을 사용한다.
- 슈퍼 트렌드 파라미터를 잘못 설정하면 스톱 패드가 너무 넓거나 너무 좁아질 수 있다. 다양한 파라미터 조합을 테스트할 수 있다.
- 재원 관리 문제는 고려되지 않았다. 위치 통제를 설정해야 한다.
- 거래 비용은 고려되지 않았습니다.
전략 최적화 방향
- 슈퍼 트렌드 파라미터 조합을 최적화하여 최적의 파라미터를 찾습니다.
- 포지션 컨트롤 기능이 추가되었습니다.
- 추가 비용 고려 사항, 예를 들어 수수료, 점유율 등
- 트렌드 강점과 약점에 따라 스톱 로드 규모를 유연하게 조정할 수 있다.
- 다른 지표와 결합하여 진입 신호를 필터링하는 것을 고려하십시오.
요약하다
이 전략은 Heikin Ashi와 슈퍼 트렌드 두 지표의 장점을 통합하여 트렌드 방향을 포착 할 수 있으며, 동시에 슈퍼 트렌드를 사용하여 자동화된 동적 추적 스톱을 구현하여 트렌드 수익을 잠금 할 수 있습니다. 전략의 위험은 주로 트렌드 반전과 변수 최적화에서 비롯되며, 두 가지 측면 모두 추가 최적화를 통해 개선 할 수 있습니다.
전략 소스 코드
/*backtest
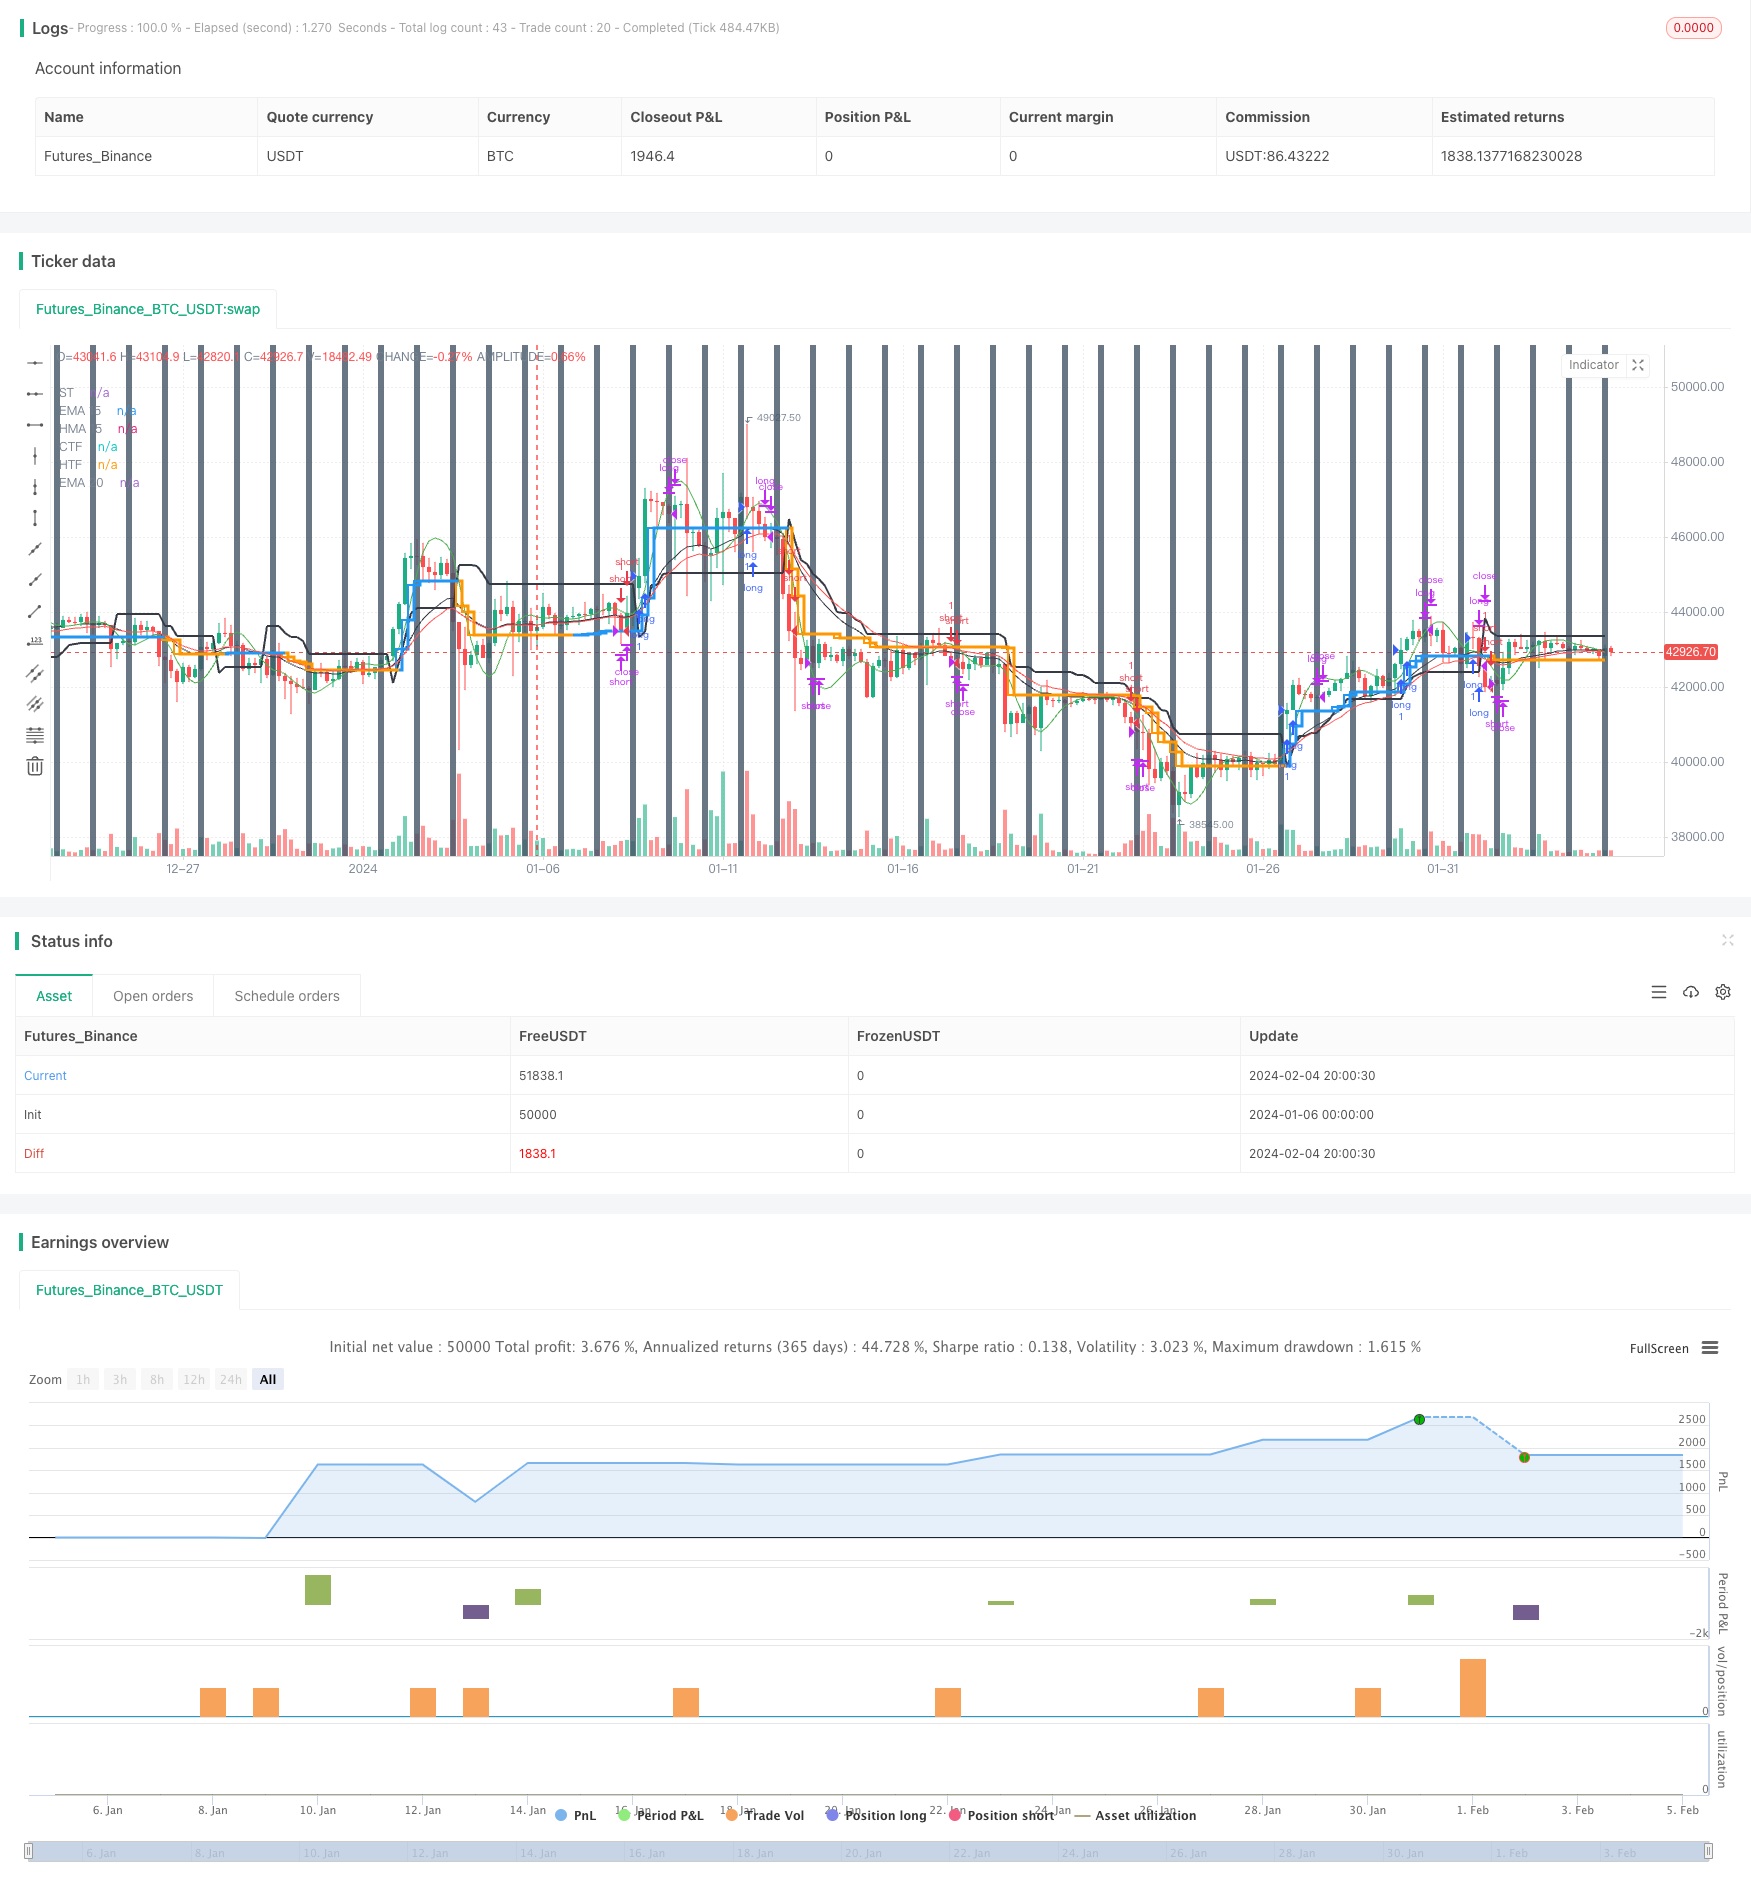
start: 2024-01-06 00:00:00
end: 2024-02-05 00:00:00
period: 4h
basePeriod: 15m
exchanges: [{"eid":"Futures_Binance","currency":"BTC_USDT"}]
*/
// This source code is subject to the terms of the Mozilla Public License 2.0 at https://mozilla.org/MPL/2.0/
// © ringashish
//@version=4
strategy("sa-strategy with HTF-TSL", overlay=true)
Pd = input(title="ATR Period", type=input.integer, defval=4)
Factor = input(title="ATR Multiplier", type=input.float, step=0.1, defval=2)
ST= supertrend(Factor, Pd)
heikinashi_close = security(heikinashi(syminfo.tickerid), timeframe.period, close)
heikinashi_low = security(heikinashi(syminfo.tickerid), timeframe.period, low)
heikinashi_open = security(heikinashi(syminfo.tickerid), timeframe.period, open)
heikinashi_high = security(heikinashi(syminfo.tickerid), timeframe.period, high)
heikinashi_close30 = security(heikinashi(syminfo.tickerid), "30", close)
//res1 = input("30", type=input.resolution, title="higher Timeframe")
//CCI TSL
res = input("240",type=input.resolution,title = "Higher Time Frame")
CCI = input(20)
ATR = input(5)
Multiplier=input(1,title='ATR Multiplier')
original=input(false,title='original coloring')
thisCCI = cci(close, CCI)
lastCCI = nz(thisCCI[1])
calcx()=>
bufferDn= high + Multiplier * sma(tr,ATR)
bufferUp= low - Multiplier * sma(tr,ATR)
if (thisCCI >= 0 and lastCCI < 0)
bufferUp := bufferDn[1]
if (thisCCI <= 0 and lastCCI > 0)
bufferDn := bufferUp[1]
if (thisCCI >= 0)
if (bufferUp < bufferUp[1])
bufferUp := bufferUp[1]
else
if (thisCCI <= 0)
if (bufferDn > bufferDn[1])
bufferDn := bufferDn[1]
x = 0.0
x := thisCCI >= 0 ?bufferUp:thisCCI <= 0 ?bufferDn:x[1]
x
tempx = calcx()
calcswap() =>
swap = 0.0
swap := tempx>tempx[1]?1:tempx<tempx[1]?-1:swap[1]
swap
tempswap = calcswap()
swap2=tempswap==1?color.blue:color.orange
swap3=thisCCI >=0 ?color.blue:color.orange
swap4=original?swap3:swap2
//display current timeframe's Trend
plot(tempx,"CTF",color=swap4,transp=0,linewidth=2, style = plot.style_stepline)
htfx = security(syminfo.tickerid,res,tempx[1],lookahead = barmerge.lookahead_on)
htfswap4 = security(syminfo.tickerid,res,swap4[1],lookahead = barmerge.lookahead_on)
plot(htfx,"HTF",color=htfswap4,transp=0,linewidth=3,style = plot.style_stepline)
//supertrend
Supertrend(Factor, Pd) =>
Up=hl2-(Factor*atr(Pd))
Dn=hl2+(Factor*atr(Pd))
TrendUp = 0.0
TrendUp := heikinashi_close[1]>TrendUp[1] ? max(Up,TrendUp[1]) : Up
TrendDown = 0.0
TrendDown := heikinashi_close[1]<TrendDown[1]? min(Dn,TrendDown[1]) : Dn
Trend = 0.0
Trend := heikinashi_close > TrendDown[1] ? 1: heikinashi_close< TrendUp[1]? -1: nz(Trend[1],1)
Tsl = Trend==1? TrendUp: TrendDown
S_Buy = Trend == 1 ? 1 : 0
S_Sell = Trend != 1 ? 1 : 0
[Trend, Tsl]
[Trend,Tsl] = Supertrend(Factor, Pd)
// Security
//ST1_Trend_MTF = security(syminfo.tickerid, res1, Tsl,barmerge.lookahead_on)
//plot(ST1_Trend_MTF, "higher ST")
crossdn = crossunder(heikinashi_close,Tsl) or crossunder(heikinashi_close[1],Tsl) or crossunder(heikinashi_close[2],Tsl) or heikinashi_close < Tsl
crossup = crossover(heikinashi_close,Tsl) or crossover(heikinashi_close[1],Tsl) or crossover(heikinashi_close[2],Tsl) or heikinashi_close > Tsl
plot(Tsl,"ST",color = color.black,linewidth =2)
plot(ema(heikinashi_close,20),"EMA 20",color=color.red)
plot(hma(heikinashi_close,15),"HMA 15",color=color.green)
plot(ema(heikinashi_close,15),"EMA 15",color=color.black)
closedown = (heikinashi_close < hma(heikinashi_close,15) and heikinashi_high > hma(heikinashi_close,15)) or(heikinashi_close < ema(heikinashi_close,20) and heikinashi_high > ema(heikinashi_close,20))
closeup = (heikinashi_close > hma(heikinashi_close,15) and heikinashi_low < hma(heikinashi_close,15)) or (heikinashi_close > ema(heikinashi_close,20) and heikinashi_low < ema(heikinashi_close,20))
buy = heikinashi_open == heikinashi_low and closeup and crossup and close > htfx
//buy = heikinashi_open == heikinashi_low and heikinashi_close > ema(close,20) and heikinashi_low < ema(close,20) and crossup
buyexit = cross(close,tempx) //heikinashi_open == heikinashi_high //and heikinashi_close < ema(close,15) and heikinashi_high > ema(close,15)
//if heikinashi_close30[1] < ST1_Trend_MTF
//sell = heikinashi_open == heikinashi_high and heikinashi_close < ema(close,20) and heikinashi_high > ema(close,20) and rsi(close,14)<60 and crossdn
sell = heikinashi_open == heikinashi_high and closedown and rsi(close,14)<55 and crossdn and close < htfx
sellexit = cross(close,tempx) //heikinashi_open == heikinashi_low //and heikinashi_close > ema(close,15) and heikinashi_low < ema(close,15)
rg = 0
rg := buy ? 1 : buyexit ? 2 : nz(rg[1])
longLogic = rg != rg[1] and rg == 1
longExit = rg != rg[1] and rg == 2
//plotshape(longExit,"exit buy",style = shape.arrowup,location = location.belowbar,color = color.red, text ="buy exit", textcolor = color.red)
//plotshape(longLogic,"BUY",style = shape.arrowup,location = location.belowbar,color = color.green, text ="buy", textcolor= color.green)
nm = 0
nm := sell ? 1 : sellexit ? 2 : nz(nm[1])
shortLogic = nm != nm[1] and nm == 1
shortExit = nm != nm[1] and nm == 2
//plotshape(shortExit,"exit sell",style = shape.arrowup,location = location.belowbar,color = color.red, text ="sell exit", textcolor = color.red)
//plotshape(shortLogic,"SELL",style = shape.arrowup,location = location.belowbar,color = color.green, text ="sell", textcolor= color.green)
//Exit at particular time
ExitHour = input(title="Exit Hour Of Day", type=input.integer, defval=15, step = 5, maxval = 24, minval = 0)
ExitMint = input(title="Exit Minute Of Day", type=input.integer, defval=15, step = 5, maxval = 24, minval = 0)
bgc = input(title="Highlight Background Color?", type=input.bool, defval=true)
mRound(num,rem) => (floor(num/rem)*rem)
exitTime = (hour(time) >= ExitHour and (minute == mRound(ExitMint, timeframe.multiplier))) ? 1 : 0
exitTime := exitTime == 0 ? (hour(time) >= ExitHour and (minute + timeframe.multiplier >= ExitMint)) ? 1 : 0 : exitTime
MarketClose = exitTime and not exitTime[1]
alertcondition(exitTime and not exitTime[1], title="Intraday Session Close Time", message="Close All Positions")
bgcolor(exitTime and not exitTime[1] and bgc ? #445566 : na, transp =40)
longCondition = longLogic
if (longCondition)
strategy.entry("long", strategy.long)
shortCondition = shortLogic
if (shortCondition)
strategy.entry("short", strategy.short)
strategy.close("short", when =cross(close,tempx) or MarketClose)
strategy.close( "long", when =cross(close,tempx) or MarketClose )