다중 시간 규모 적응 진동 프로파일 추적 전략

개요
이 전략은 호드릭-프레스콧 (Hodrick-Prescott, HP) 필터를 사용하여 가격을 평형화하고 가격 트렌드 라인을 추출합니다. 그리고 사용자 정의 된 시간 범위를 기반으로 사용자 정의 된 중화 평균 가격을 계산합니다. 가격이 트렌드 라인보다 높을 때 더 많이하고, 낮은 경우 더 많이하지 않습니다.
전략 원칙
-
HP 필터를 사용하여 가격 트렌드 라인을 추출한다. HP 필터는 최적화 방법을 통해 가격의 장기 트렌드 성분을 추출하고, 단기 변동의 방해를 제거한다.
-
사용자 지정된 시간 범위를 기반으로 VWAP를 계산한다. VWAP는 다른 주기에서의 평균 가격을 더 정확하게 나타낸다.
-
가격이 HP 트렌드 라인보다 높을 때 다중 조건이 충족되고, 가격이 HP 트렌드 라인보다 낮을 때 공백 조건이 충족된다. 이렇게 하면 가격이 아래에서 위로 또는 위에서 아래로 돌파구를 잡을 수 있다.
-
ATR 상쇄는 합리적인 위험을 감수하고 과도한 손실을 방지합니다.
우위 분석
-
HP 필터를 사용하여 가격 동향을 추출하고, MA와 같은 지표에 비해 더 부드럽고, 단기 가격 변동에 착각하지 않도록 한다.
-
사용자 정의 VWAP 주기, 시장 주기 변화에 더 유연하게 적응한다.
-
트렌드 방향에 따라 거래하는 것은 트렌드 트레이딩 철학에 부합하며, 승률이 높다.
-
ATR는 단편 손실을 통제하여 과대 손실을 방지합니다.
-
다양한 매개 변수들을 조정할 수 있으며, 다양한 시장에 맞게 최적화할 수 있다.
위험과 대책
-
진동 디스크 정리에서 스탠다드 손실이 발생할 수 있다. 스탠다드 손실 범위를 적절히 완화할 수 있다.
-
트렌드 말기 ClientRawResponse는 종종 회귀 시동 탐색적 돌파구가 발생하여 전략이 좌우된다. 다른 지표와 결합하여 트렌드 말기, 적시에 평정해야 한다.
-
VWAP 주기 설정이 부적절하면 더 효과적인 거래 기회를 놓칠 수 있다. VWAP 주기 조정은 트렌드 지표의 동적으로 이루어져야 한다.
최적화 방향
1.HP 필터 변수 λ은 평준화 강도를 조정할 수 있다. △λ 값은 큰 시간에 트렌드 라인이 더 부드럽고, 긴 선의 트렌드를 잡는 데 더 유리하다. △λ 값은 시간의 가격 변화에 더 민감하며, 중간에 짧은 선의 기회를 잡는 데 더 적합하다.
-
ATR 배수는 손해의 범위를 조정할 수 있다.λ 변수 최적화와 연동할 수 있으며,λ 값이 커지면 손해의 범위를 적절히 확장할 수 있다.λ 값이 작으면 손해의 범위를 축소하여 더 많은 이익을 잠금할 수 있다.
-
리스크 수익률 (R:R) 은 수익/손실 비율에 직접적으로 영향을 미칩니다. 회수 제어와 수익성을 테스트할 수 있는 다른 배수 조건이 있습니다.
요약하다
이 전략은 전체적으로 트렌드 추적 아이디어 디자인을 채택한다. 여러 가지 매개 변수 설정을 통해 중·단기 다른 시간 주기에 대해 최적화 할 수 있으며, 승률과 수익성이 강하다. 위험 제어 측면에서도 어느 정도 고려가 이루어져 단편 손실이 너무 크지 않도록 효과적으로 보장한다. 전반적으로 이 전략은 보다 과학적인 방법을 사용하여 가격 트렌드 특성을 추출하고, 매개 변수 최적화 공간이 큰 특성과 결합하여 적용 전망이 좋다.
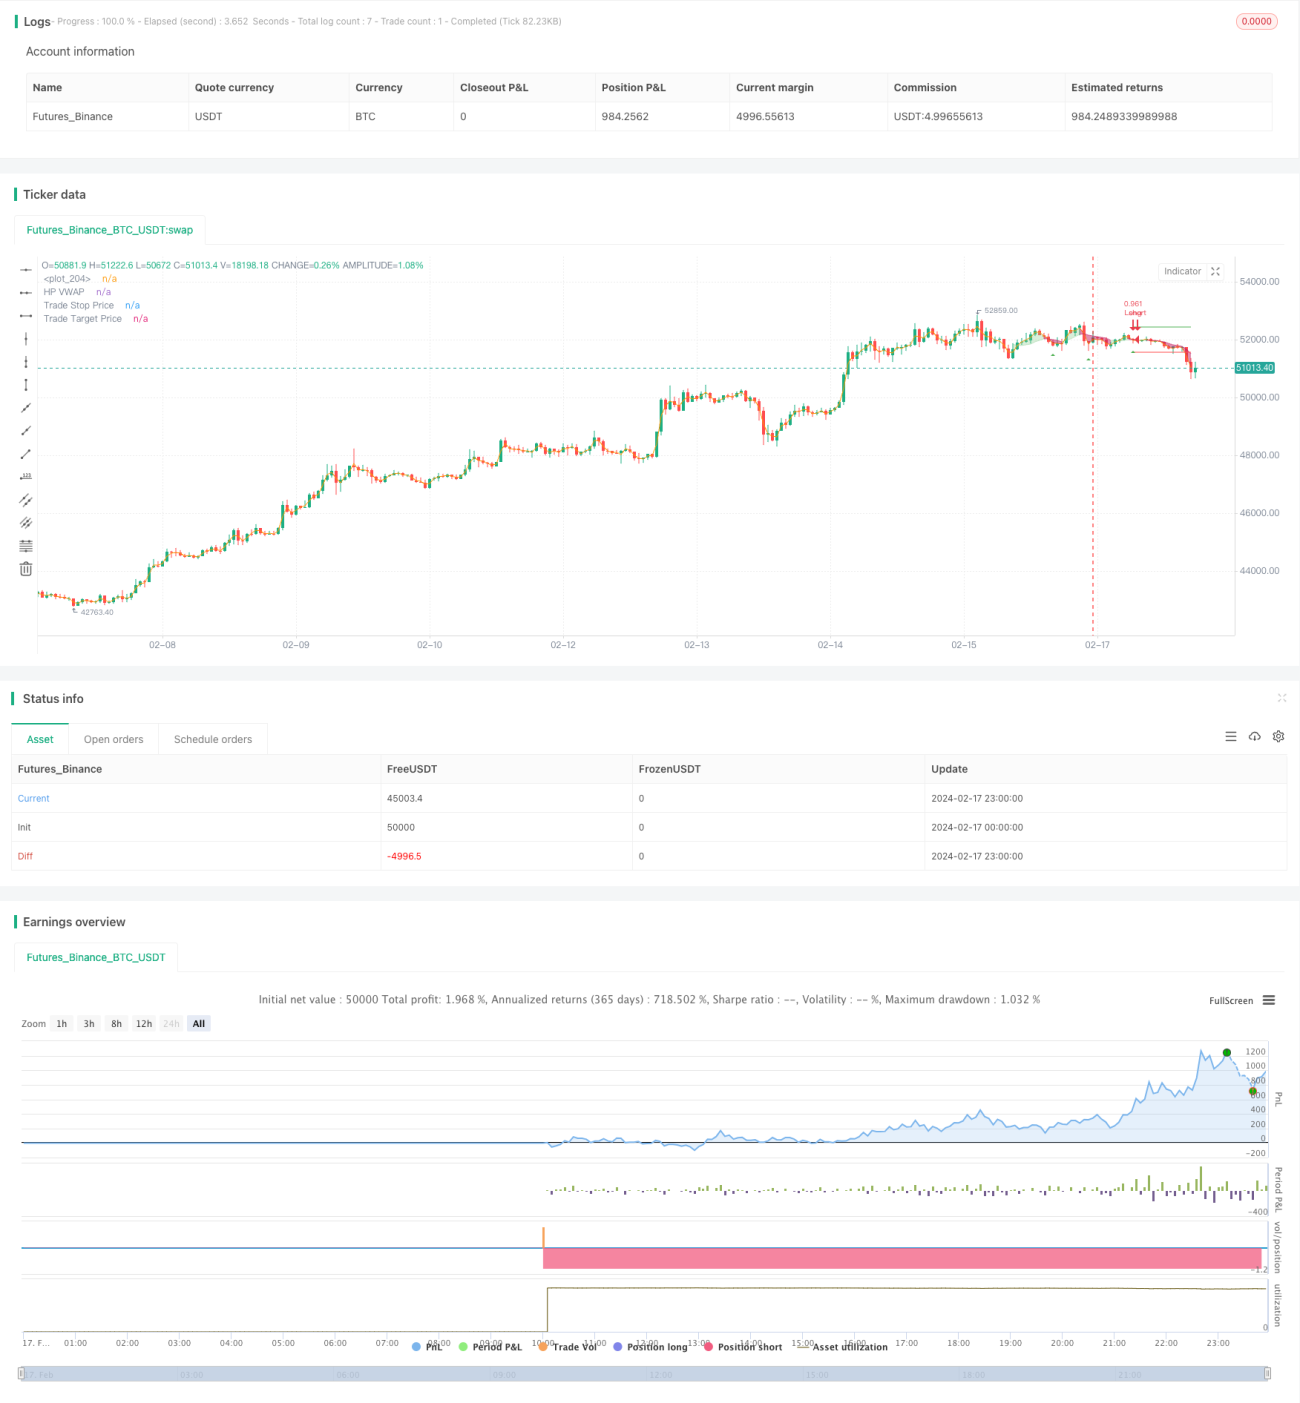
/*backtest
start: 2024-02-17 00:00:00
end: 2024-02-18 00:00:00
period: 1h
basePeriod: 15m
exchanges: [{"eid":"Futures_Binance","currency":"BTC_USDT"}]
*/

// This source code is subject to the terms of the Mozilla Public License 2.0 at https://mozilla.org/MPL/2.0/
// © tathal animouse hajixde

//@version=4- 1