개요
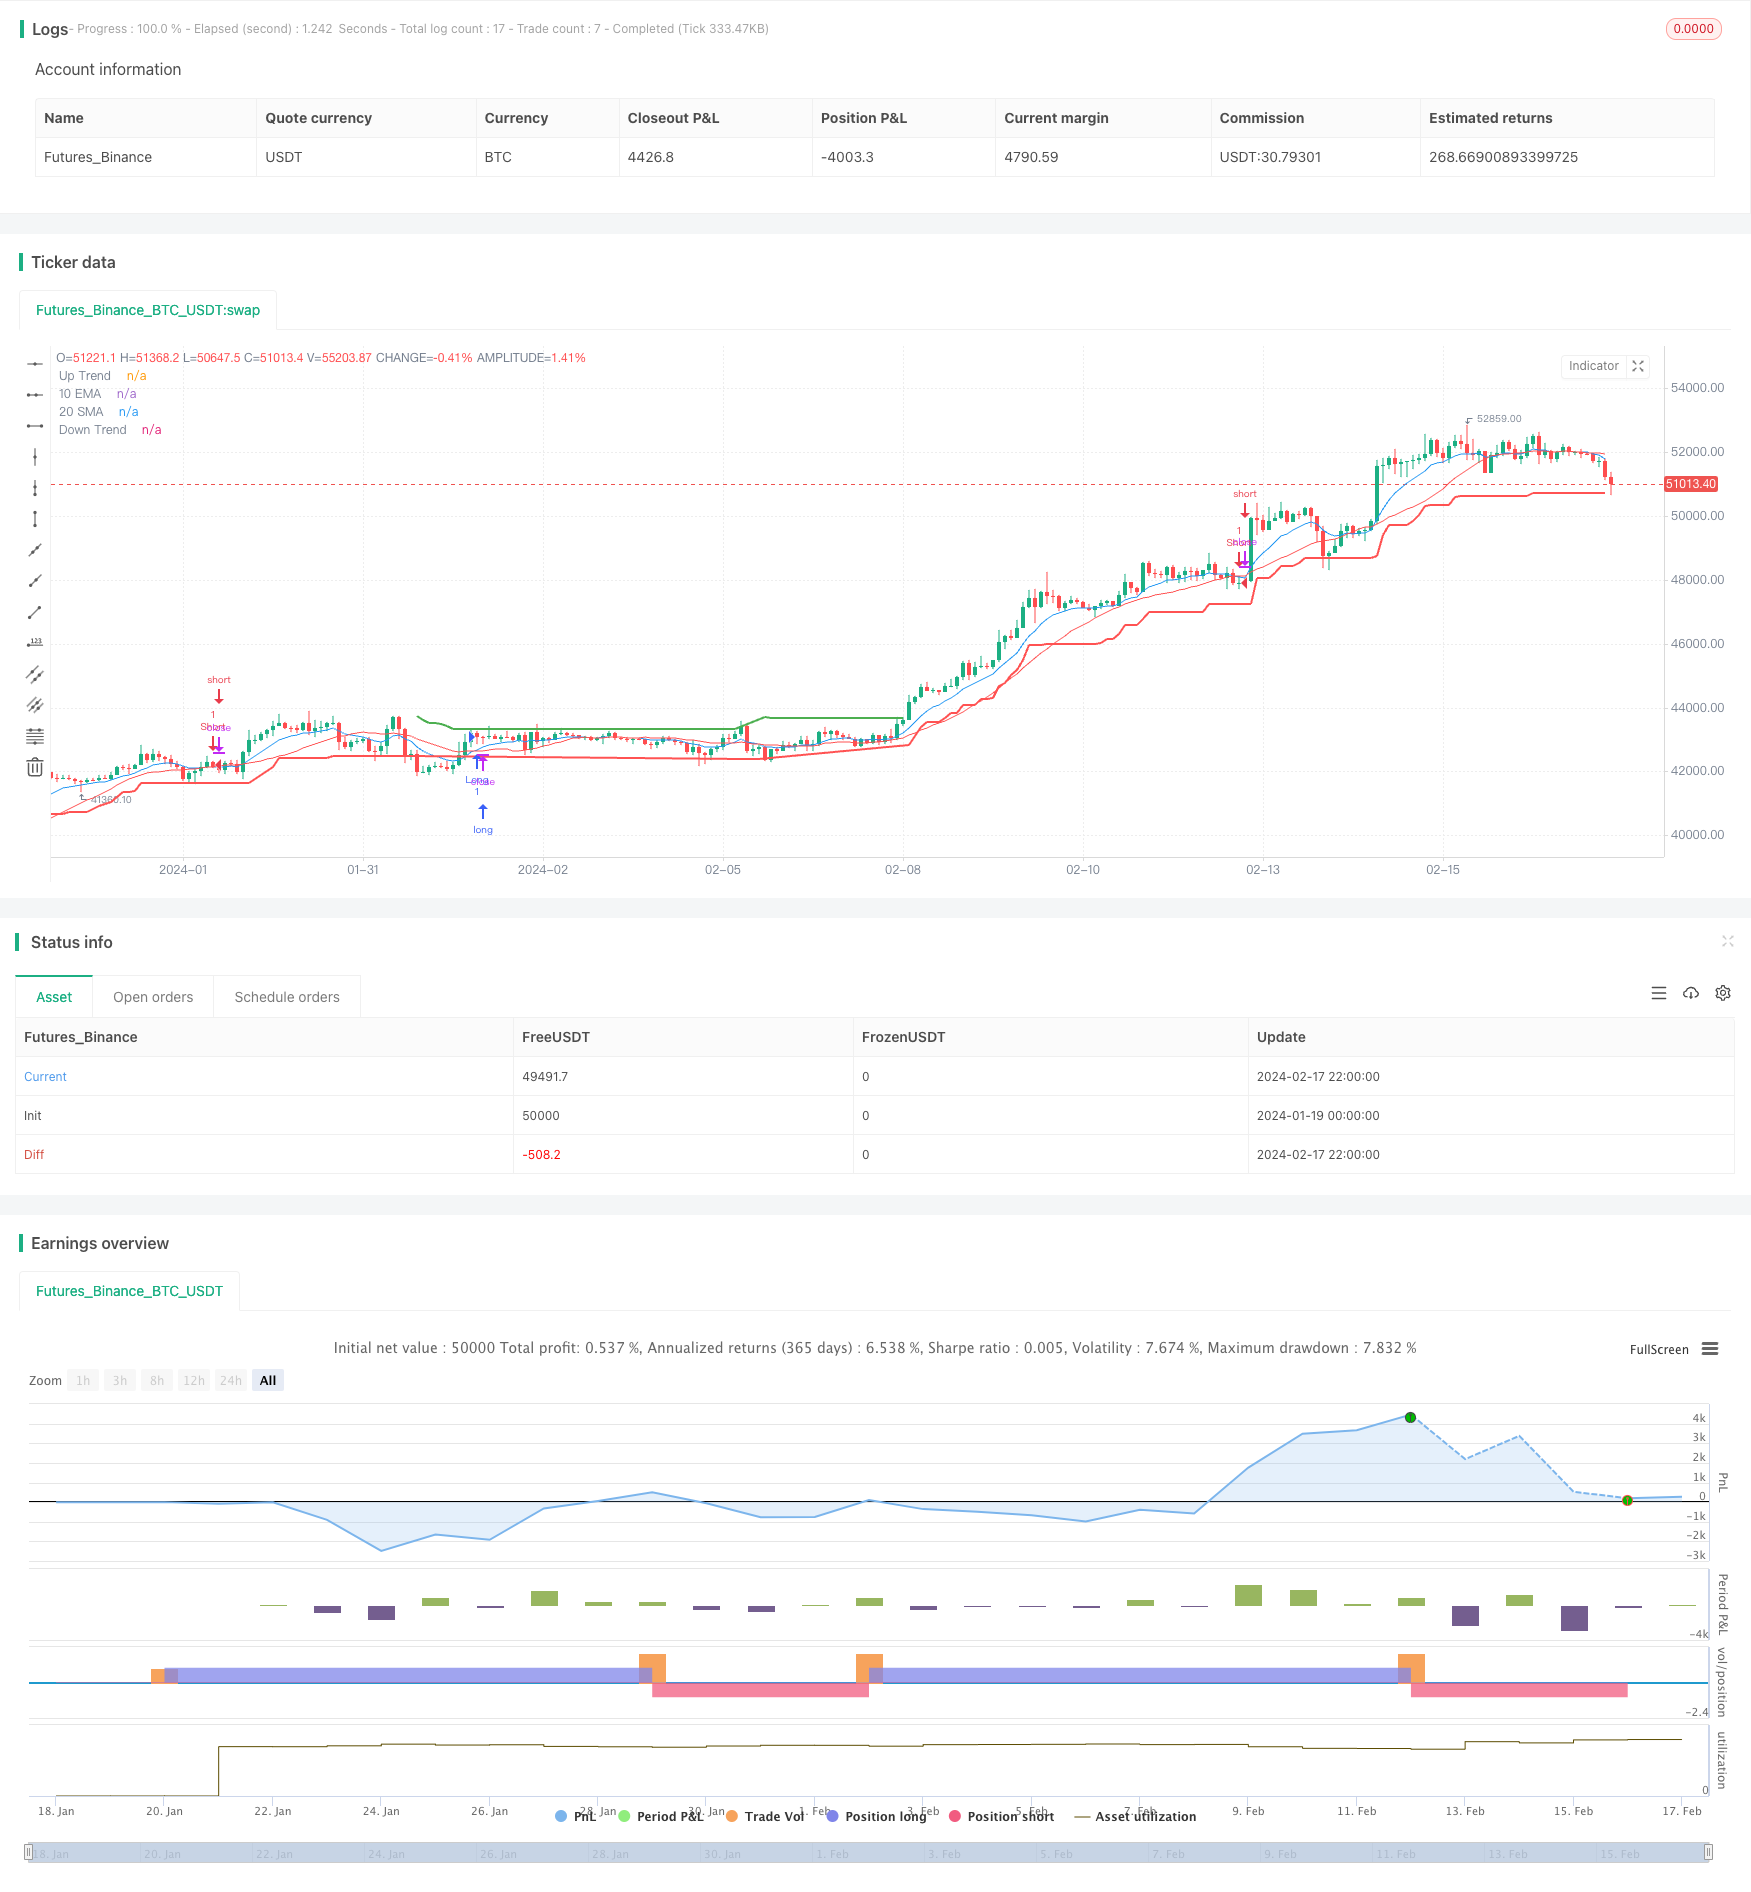
이 전략은 슈퍼 트렌드를 이동 평균과 결합한 전략이라고 한다. 이 전략은 슈퍼 트렌드 지표와 이동 평균을 사용하여 슈퍼 트렌드가 상승 추세를 표시하고 10 일 EMA가 20 일 SMA보다 높을 때 더 많은 것을 하고, 슈퍼 트렌드가 하락 추세를 표시하고 10 일 EMA가 20 일 SMA보다 낮을 때 빈 것을 하는 전형적인 트렌드 추적 전략이다.
전략 원칙
이 전략은 슈퍼 트렌드 지표를 사용하여 시장 트렌드 방향을 판단한다. 슈퍼 트렌드 지표는 Average True Range와 Factor에 기초하여 계산되며, 가격이 슈퍼 트렌드 라인보다 높을 때 상승 추세이며, 가격이 슈퍼 트렌드 라인보다 낮을 때 하락 추세이다. 이 전략의 Factor는 3.0이며, ATR 길이는 10이다.
또한, 전략은 10일 EMA와 20일 SMA를 사용하여 이동 평균을 구성한다. EMA (인덱스 이동 평균) 는 최근의 가격에 더 높은 무게를 부여하고, SMA (단순 이동 평균) 는 모든 데이터를 동등한 무게로 고려한다. 단기 EMA가 장기 SMA보다 높을 때, 구매 신호로 간주된다.
전체적으로, 이 전략의 거래 신호 생성 논리는 다음과 같습니다.
다중 입구: 초고향>0 (상향) 과 10일 EMA>20일 SMA
공중 입시: 초고향 (~ 하향) 과 10일 EMA <20일 SMA
즉, 슈퍼 트렌드가 트렌드 방향을 결정하는 동시에, 이동 평균의 골드 포크 사다리를 보조 판단으로 사용하여 트렌드 추적 전략을 구축한다.
우위 분석
이 전략의 가장 큰 장점은 슈퍼 트렌드와 이동 평균 두 지표를 결합하여 신뢰성과 민감성이 향상된다는 것입니다. 구체적으로 다음과 같은 몇 가지 장점이 있습니다.
- 슈퍼 트렌드 지표는 주 트렌드를 매우 명확하게 판단하여 잘못된 신호를 줄일 수 있습니다.
- EMA와 SMA의 조합은 트렌드 전환에 대한 민감성을 높일 수 있습니다.
- 동시에 여러 요소를 판단하고, 통합 판단 신호, 신뢰성이 높습니다.
- 간단하고 명확한 지표를 사용하여 이해하기 쉽고 최적화 할 수 있습니다.
- 슈퍼 트렌드 및 이동 평균의 파라미터를 구성할 수 있으며, 최적화 할 수있는 공간이 넓습니다.
위험 분석
이 전략에는 다음과 같은 몇 가지 위험도 있습니다.
- 슈퍼 트렌드 파라미터가 잘못 설정되면 전환점을 놓칠 수 있습니다.
- 이동 평균 파라미터를 잘못 설정하면 잘못된 신호가 발생할 수 있습니다.
- 잘못된 회귀주기를 선택하여 전략 효과를 과대평가할 수 있습니다.
- 거래 비용의 영향을 고려하지 않습니다.
슈퍼 트렌드에서는 다양한 ATR 길이를 테스트하고, 여러 가지 요소를 테스트하여 최적화할 수 있습니다. 이동 평균에서는 EMA와 SMA의 길이를 테스트할 수 있습니다. 재검토 주기는 다양한 시장 환경을 충분히 고려합니다. 또한, 실적 과정에서 적절한 거래 비용을 포함해야합니다.
최적화 방향
이 전략의 최적화 공간은 넓고, 주로 다음과 같은 측면에서 최적화할 수 있다:
- 슈퍼 트렌드에서 ATR 길이를 조정하고
- EMA와 SMA의 길이 변수를 조정
- RSI, MACD 등과 같은 다른 지표의 필터 신호를 추가합니다.
- 구매 조건이 수퍼 트렌드 상승으로 조정되고 SMA를 통과한 후 EMA를 조정합니다.
- 추가된 스톱로스 전략
매개 변수를 조정하고 보조 지표 필터를 추가함으로써 전략의 성과와 안정성을 더욱 향상시킬 수 있습니다. 또한, 스톱 손실 전략의 구성은 위험을 효과적으로 제어하는 데 중요합니다.
요약하다
이 전략의 이름은 슈퍼 트렌드와 이동 평균을 결합한 전략 이다. 슈퍼 트렌드를 사용하여 트렌드 방향을 판단하고, EMA와 SMA를 사용하여 거래 신호를 구성하는 전략은 전형적인 트렌드 추적 전략에 속한다. 이 전략은 신뢰성이 높으며, 최적화 공간이 넓으며, 실험실 검증 최적화를 할 가치가 있다. 그러나 위험을 제어하고, 변수 최적화를 과도하게 방지하는 데 주의를 기울여야 한다.
/*backtest
start: 2024-01-19 00:00:00
end: 2024-02-18 00:00:00
period: 2h
basePeriod: 15m
exchanges: [{"eid":"Futures_Binance","currency":"BTC_USDT"}]
*/

//@version=5
strategy("Supertrend and Moving Averages Strategy", overlay=true)

// Supertrend parameters
atrLength = input.int(10, title="ATR Length", minval=1)
factor = input.float(3.0, title="Factor", minval=0.01, step=0.01)
[supertrend, direction] = ta.supertrend(factor, atrLength)

// Moving Averages parameters
length_ema = input(10, title="Length of EMA")
length_sma = input(20, title="Length of SMA")

// Calculate EMAs and SMAs
ema_10 = ta.ema(close, length_ema)
sma_20 = ta.sma(close, length_sma)

// Strategy logic
longCondition = ema_10 > sma_20 and direction > 0
shortCondition = ema_10 < sma_20 and direction < 0

strategy.entry("Long", strategy.long, when=longCondition)
strategy.entry("Short", strategy.short, when=shortCondition)

// Plot Supertrend
plot(direction > 0 ? supertrend : na, color=color.green, style=plot.style_line, linewidth=2, title="Up Trend")
plot(direction < 0 ? supertrend : na, color=color.red, style=plot.style_line, linewidth=2, title="Down Trend")

// Plot Moving Averages
plot(ema_10, color=color.blue, title="10 EMA")
plot(sma_20, color=color.red, title="20 SMA")

// Alerts for Supertrend
alertcondition(direction[1] > direction, title='Downtrend to Uptrend', message='The Supertrend value switched from Downtrend to Uptrend ')
alertcondition(direction[1] < direction, title='Uptrend to Downtrend', message='The Supertrend value switched from Uptrend to Downtrend')
alertcondition(direction[1] != direction, title='Trend Change', message='The Supertrend value switched from Uptrend to Downtrend or vice versa')