축적 단계 전략의 정량적 식별

개요
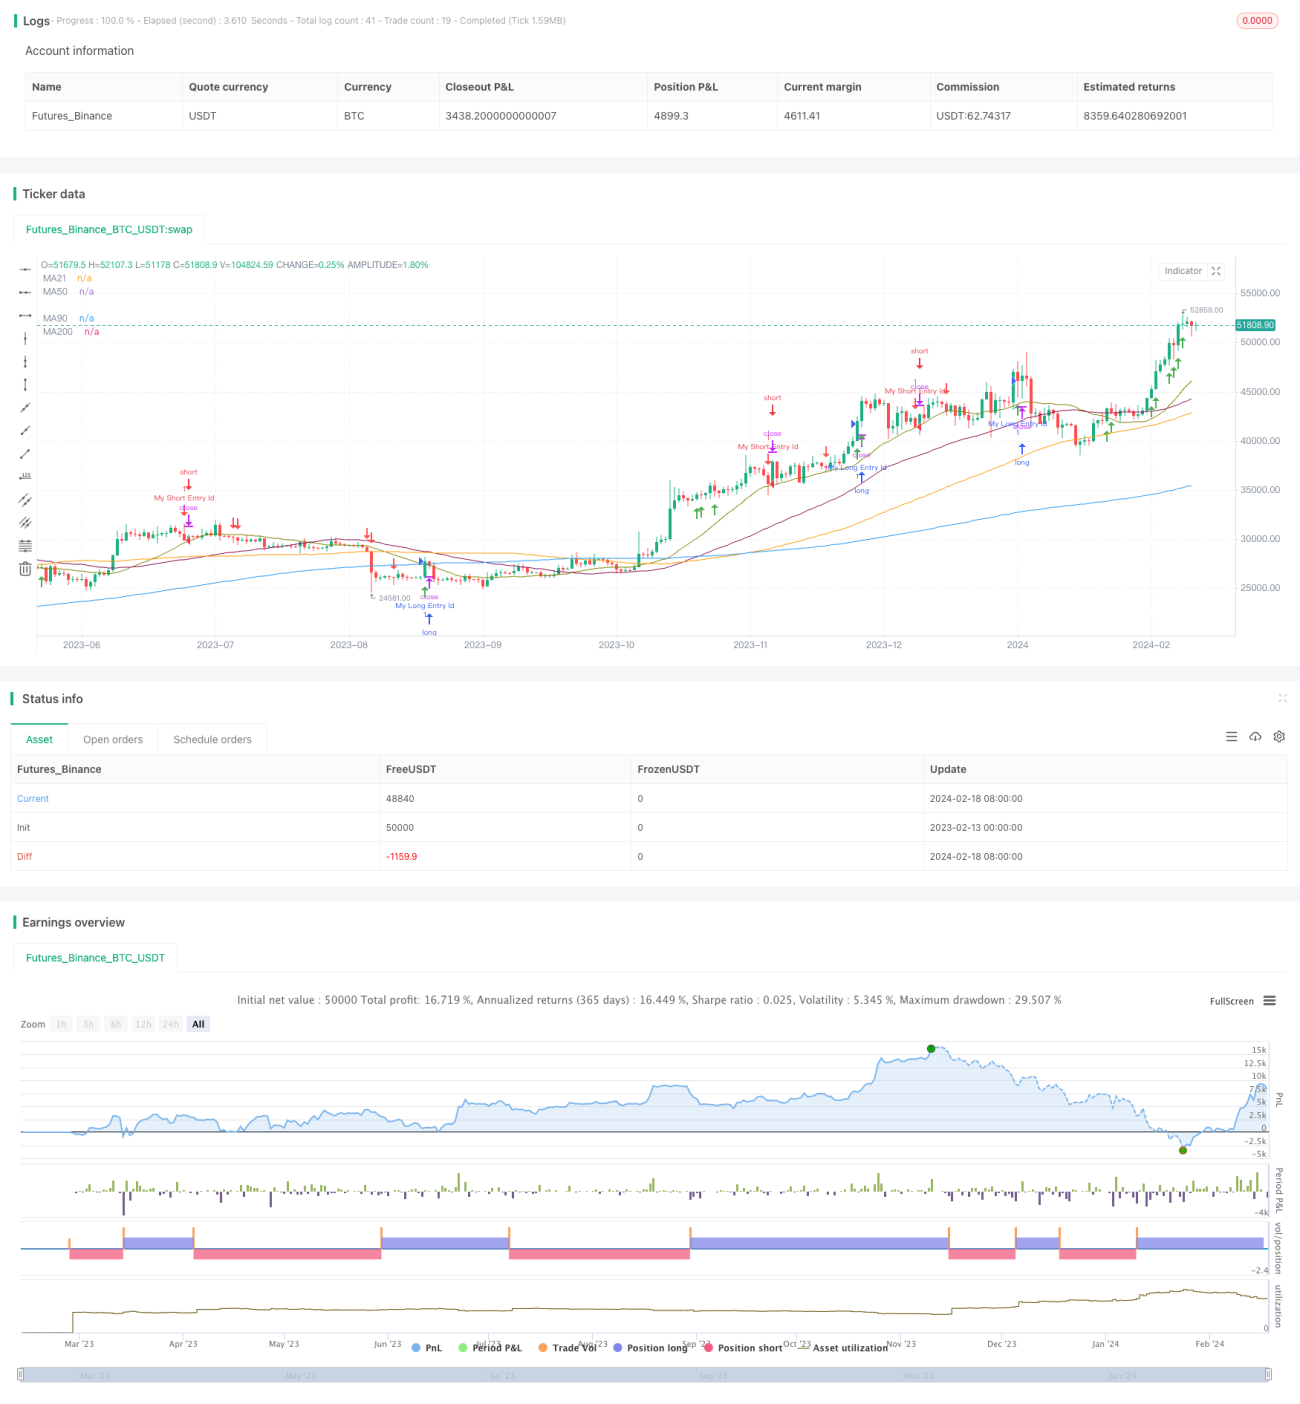
이 전략은 이동 평균, 거래량 지표 및 가격 운동 지표를 조합하여 주식이 축적 단계에 들어가는 시점을 식별하기 위해 정량화 규칙을 설계합니다. 이 단계에서 주식은 일반적으로 가격의 평형 및 축적 상태에 있으며, 낮은 가격 입장이 좋은 기회를 제공합니다.
전략 원칙
전략은 50일, 90일, 200일 간단한 이동 평균을 사용하여 가격 추세를 판단한다. 가격이 200일선보다 높을 때만 구매 신호가 발생한다. 이것은 큰 추세 하락의 불확실성을 필터링 할 수 있다.
큰 트렌드를 판단하는 것 외에도 전략은 단기 평균선 순서를 판단하여 트렌드를 확인한다. 구체적으로, 50 일선이 90 일선보다 높다고 판단한다.
이동 평균이 큰 트렌드를 확인하고 단기 트렌드가 적합하다는 것을 기반으로, 전략은 거래량 지표 PVT와 MACD 지표를 결합하여 누적 특성을 판단합니다. PVT가 상향으로 돌파되고 MACD 라인이 신호 라인보다 높고 거래량이 확대되면 구매 신호가 발생합니다.
전략적 이점
이동 평균을 단독으로 사용하는 것보다, 이 전략은 트렌드를 확인하면서 거래량 특성을 검사한다. 이것은 주식이 축적 단계에 들어가는 시기를 더 정확하게 판단하여 입시 가격 우위를 보장 할 수 있다.
다중 시간 프레임 분석을 통해 이 전략은 중장기 경향 판단과 단기 특징 판단을 결합하여 시간 프레임 매칭을 통해 단일 시간 프레임 판단 오류로 인한 불확실성을 줄일 수 있다.
위험과 해결
이 전략은 주로 평평선 판단에 의존하며, 가격이 급격하게 변동할 때 평평선 판단은 무효가 된다. 이때는 포지션 규모를 줄여야 한다.
또한, 축적 단계 판단이 잘못될 수도 있고, 따라서 반전 기회를 놓칠 수도 있다. 이것은 더 많은 특징 지표를 관찰하여 판단을 확인해야 한다.
더 나은 생각
이 전략은 기계 학습 알고리즘을 도입하여 특징 추출과 모델 훈련을 통해 축적 단계에 대한 자동 판단을 구현할 수 있습니다. 이것은 인위적으로 설정된 스<unk>값으로 인한 한계를 줄일 수 있습니다.
또한 이 전략은 다른 시장 환경에서 다른 파라미터를 자동으로 전환하는 브레이크포인트 기능을 시도할 수 있습니다.
요약하다
이 전략은 전반적으로 가격과 거래량 일치하는 사고 방식을 사용하여 주식 축적 특성을 판단한다. 큰 방향을 확인하면서도 단기 축적 기회를 탐색한다. 매개 변수 최적화 및 기계 학습과 같은 수단을 도입하여 전략 효과를 더 향상시킬 여지가있다.
- 1