모멘텀 기반 브레이크아웃 전략

개요
동력 돌파 전략은 시장 동력을 추적하는 트렌드 전략이다. 그것은 시장이 현재 상승 또는 하락 추세에 있는지 판단하는 여러 지표를 결합하고, 중요한 저항 지점을 돌파 할 때 더 많은 포지션을 만들고, 중요한 지원 지점을 돌파 할 때 포지션을 <unk>다.
전략 원칙
이 전략은 주로 여러 장기간의 Donchian 채널을 계산하여 시장의 추세와 중요한 가격 수준을 판단한다. 구체적으로, 가격은 40 일간의 Donchian 채널과 같은 더 긴 주기를 돌파할 때 상승 추세로 판단하고, 그 기초에 연중의 새로운 고위, 이동 평균의 방향적 배열과 같은 필터 조건과 결합하여 여러 신호를 발송한다. 그리고 가격이 더 긴 주기의 Donchian의 하차를 넘어갈 때, 하향 추세를 판단하기 위해 연중의 새로운 낮은 필터 조건과 결합하여 빈 신호를 발송한다.
포지션 탈퇴에 있어서는 이 전략은 두 가지 옵션을 제공합니다: 고정 취소 라인 및 추적 스톱. 고정 취소 라인은 20 일 Donchian 채널과 같은 더 짧은 기간에 따라 스톱 지점을 설정합니다. 추적 스톱은 ATR 값에 따라 매일 계산되는 부동 스톱입니다. 두 가지 스톱 방식 모두 위험을 잘 제어합니다.
우위 분석
이 전략은 트렌드 판단과 브레이크 조작을 결합하여 시장에서 짧은 선의 방향적 기회를 효과적으로 포착할 수 있다. 단일 지표에 비해, 여러 가지 필터링 조건을 종합적으로 적용하여 일부 가짜 브레이크를 필터링하여 입력 신호의 품질을 향상시킬 수 있다. 또한, 손실을 막는 전략의 적용은 손실을 견딜 수 있게 해 주며, 단기간의 회귀에도 손실을 효과적으로 제어 할 수 있다.
위험 분석
이 전략의 주요 위험은 시장 상황이 급격하게 변동할 수 있으며, 이로 인해 상쇄 손실이 퇴출을 촉발 할 수 있다는 것입니다. 시장 상황이 빠르게 변하면 기회를 놓칠 수 있습니다. 또한, 여러 가지 필터 조건의 사용은 일부 기회를 필터링하여 전략의 포지션 주기를 줄일 수 있습니다.
위험을 줄이기 위해 ATR 값을 적절히 조정하거나 Donchian 궤도 간격을 확장할 수 있으며, 이는 정지 손실이 뚫릴 가능성을 줄일 수 있다. 또한 필터링 조건을 부분적으로 줄이거나 취소할 수 있으며, 진입 주파수를 높일 수 있지만 위험도 증가한다.
최적화 방향
이 전략은 다음과 같은 부분에서 최적화될 수 있습니다.
- Donchian 통로의 길이를 최적화하여 최적의 파라미터 조합을 찾습니다.
- 다른 종류의 이동 평균을 <unk>돌기 지표로 사용해보세요.
- ATR 곱셈을 조정하거나 고정 점수 정지
- MACD와 같은 트렌드 판단 지표를 추가합니다.
- 1년 동안의 새로운 고고 낮은 판단 창기 기간을 최적화합니다.
다양한 변수를 테스트하여 최적의 변수 조합을 찾아 위험과 이익 사이의 균형을 잡을 수 있습니다.
요약하다
이 전략은 여러 지표를 종합적으로 사용하여 트렌드 방향을 판단하고, 중요한 지점 지점을 돌파할 때 거래 신호를 냅니다. 그 손해 중지 메커니즘은 또한 전략에 강력한 위험 제어 능력을 부여합니다. 최적화된 매개 변수 설정을 통해 이 전략은 안정적인 초과 수익을 달성 할 수 있습니다. 시장에 대한 명확한 판단이 없지만 추세를 따라가고 싶어하는 투자자에게 적합합니다.
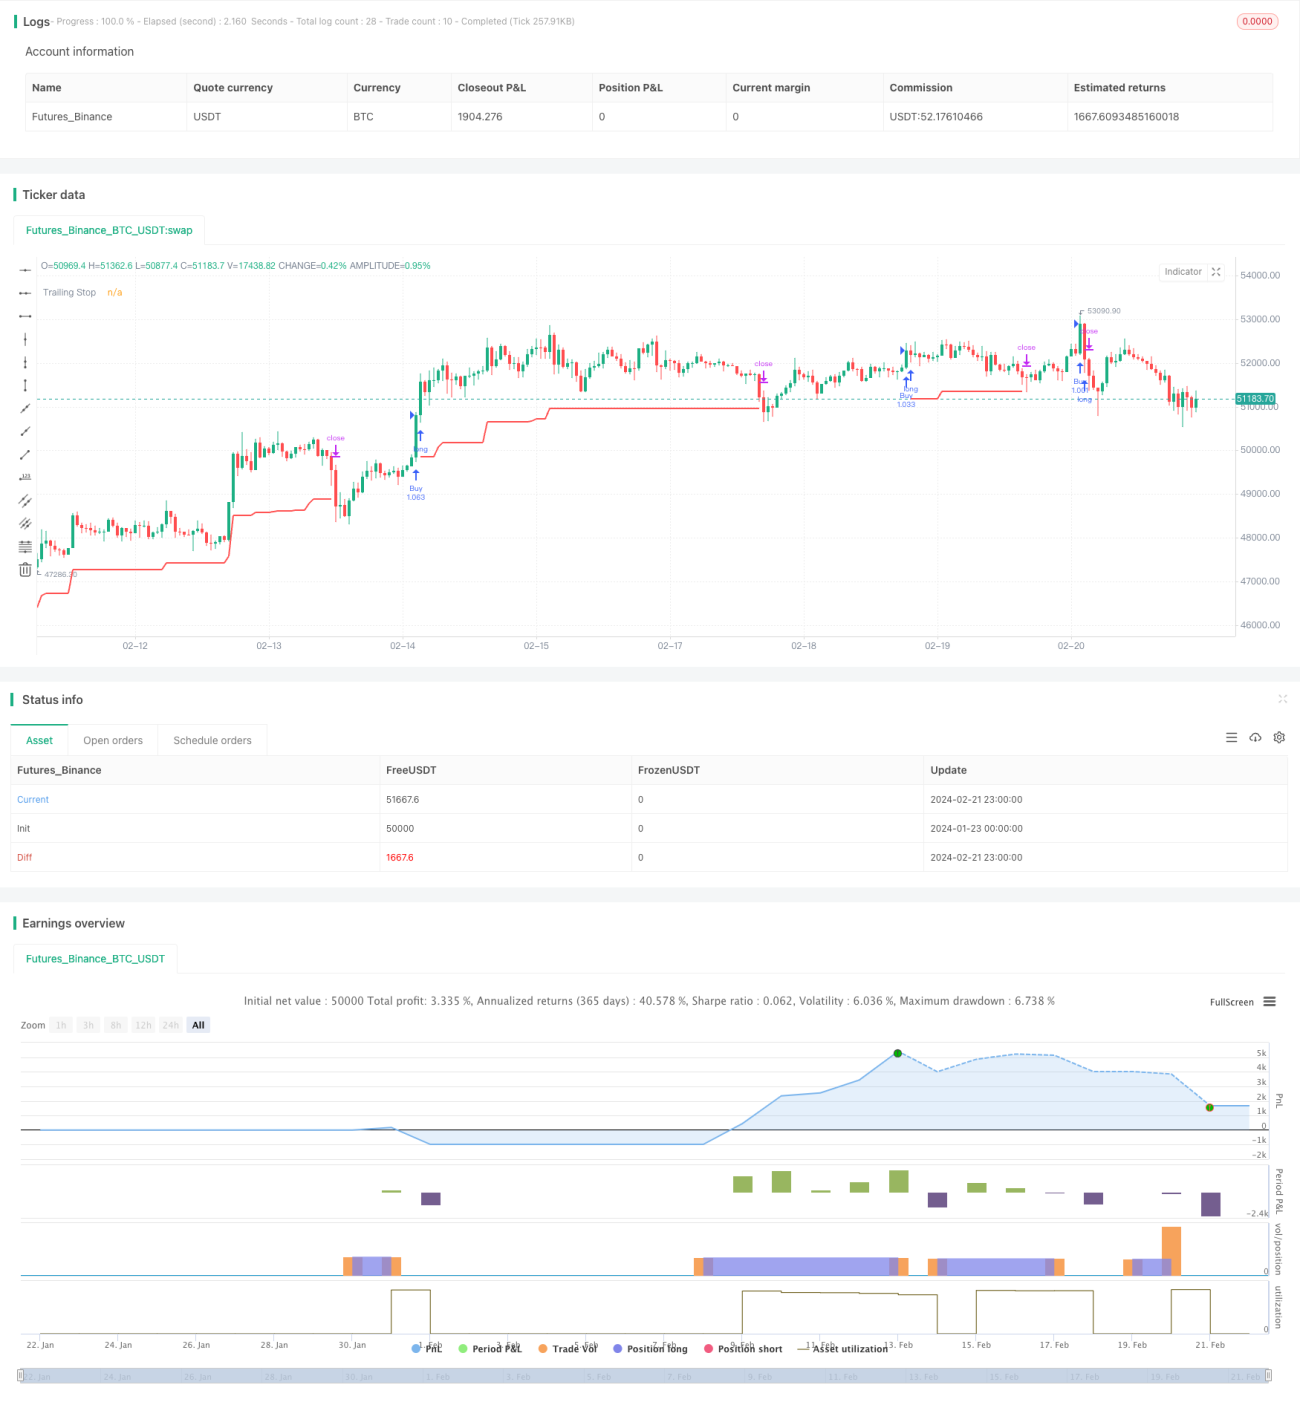
/*backtest
start: 2024-01-23 00:00:00
end: 2024-02-22 00:00:00
period: 1h
basePeriod: 15m
exchanges: [{"eid":"Futures_Binance","currency":"BTC_USDT"}]
*/

// This source code is subject to the terms of the Mozilla Public License 2.0 at https://mozilla.org/MPL/2.0/
// © HeWhoMustNotBeNamed

//@version=4- 1