볼린저 밴드와 MACD를 기반으로 한 양적 거래 전략

개요
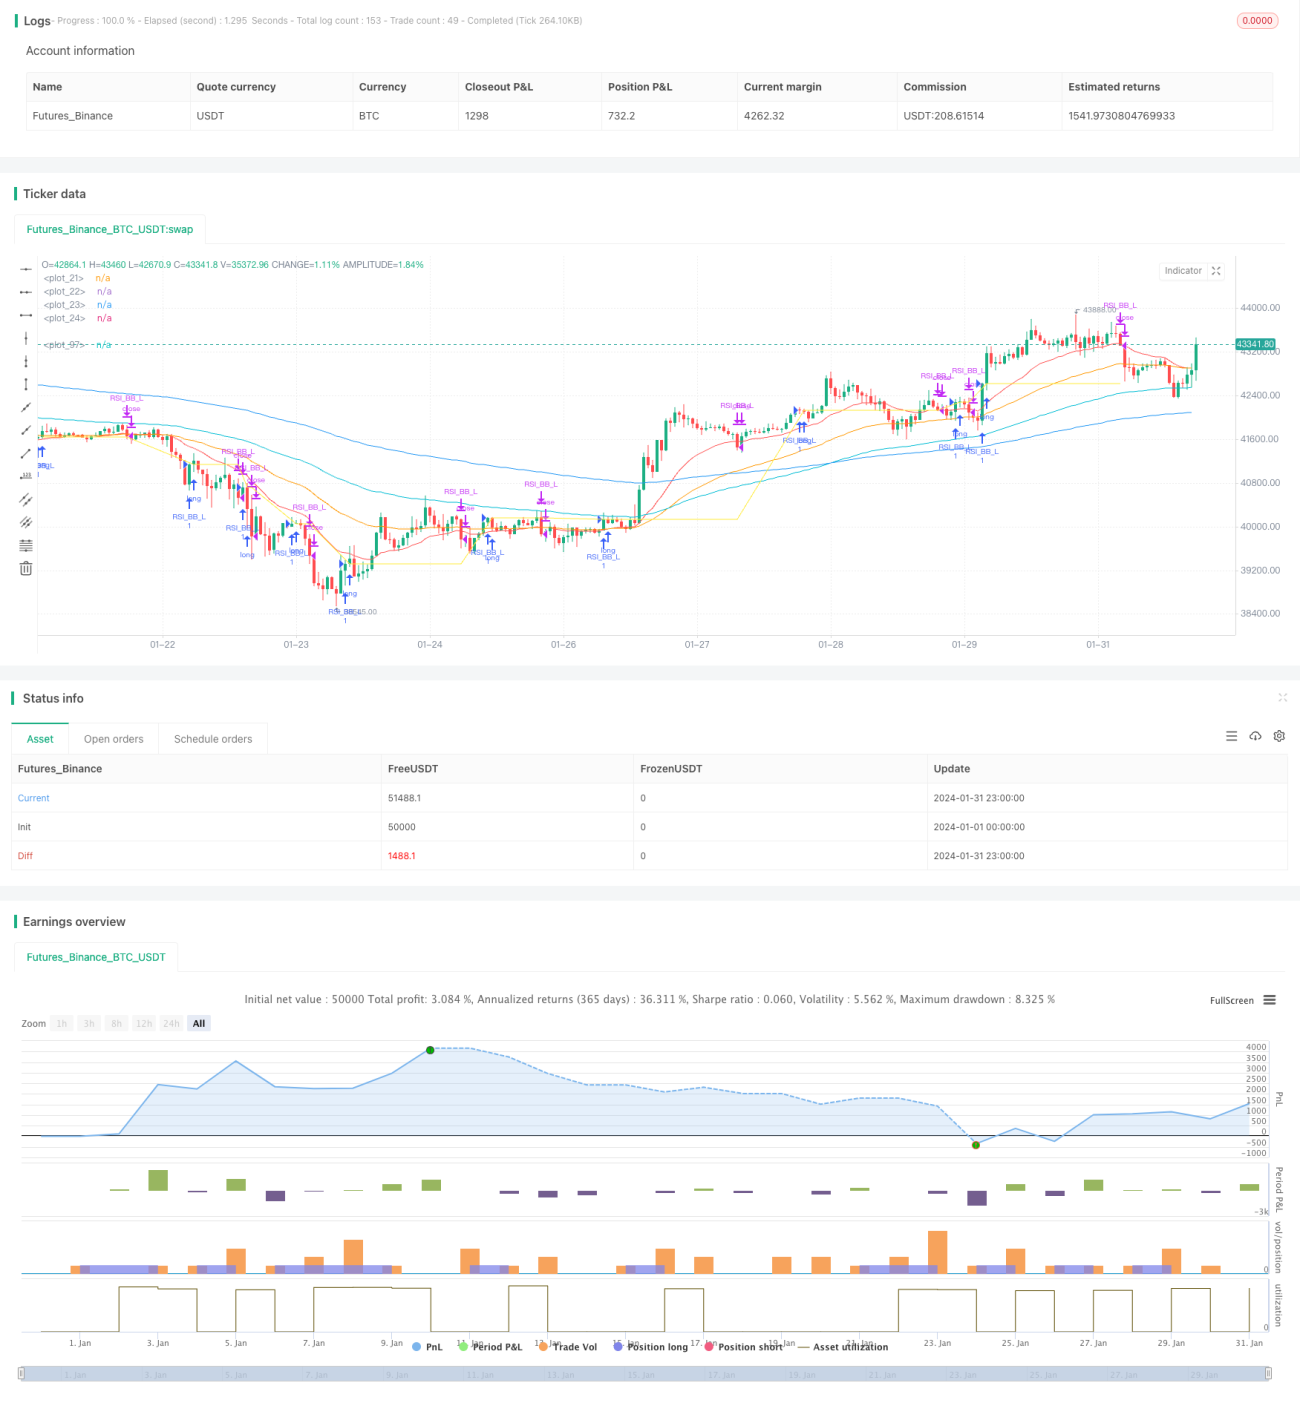
이 전략은 브린띠와 MACD 지표를 기반으로 한 양적 거래 전략이다. 그것은 브린띠의 돌파 거래와 MACD의 트렌드 추적을 결합하여 거래 신호의 질을 향상시키기 위해 고안되었다.
전략 원칙
이 전략은 주로 브린 밴드 지표와 MACD 지표의 거래 신호 판단에 기초한다.
브린 띠 지표는 중간 궤도, 상단 궤도, 하단 궤도로 구성되어 있다. 가격이 하단 궤도를 돌파할 때 구매 신호를 생성하고, 가격이 상단 궤도를 돌파할 때 판매 신호를 생성한다. 이 전략은 브린 띠의 돌파 원리를 사용하여 강력한 돌파 신호를 결정한다.
MACD 지표는 단기 및 장기 이동 평균 사이의 관계를 반영하고, 차차선과 신호선의 골드 포크, 데드 포크를 통해 구매 및 판매 시간을 판단한다. 이 전략은 MACD 지표를 사용하여 더 효과적인 구매 신호를 생성하기 위해 트레이딩 신호를 필터링합니다.
전체적으로 볼 때, 이 전략은 부린띠의 트렌드 추적과 MACD의 이동 평균 우위를 결합하여 강력한 추세에서 더 큰 시장 변동을 잡기 위해 고안되었습니다.
전략적 이점
-
브린 띠와 MACD 지표가 결합되면 거래 신호가 더욱 안정된다.
-
트렌드 상황에서, 브린띠 트렌드 추적과 MACD 이동 평균의 교차는 강력한 입문 신호를 생성할 수 있다.
-
이중 지표 판단을 통해 가짜 신호를 효과적으로 필터링하여 거래 위험을 줄일 수 있다.
-
정책 파라미터를 최적화할 수 있는 공간이 넓고, 다양한 품종과 주기에 따라 조정할 수 있다.
전략적 위험
-
위기 상황에서, 브린띠와 MACD에서 생성되는 거래 신호는 빈번하게 발생할 수 있으며, 이는 경매 위험을 초래한다.
-
MACD 지표는 하위권에서 3차례의 포크 바이 신호를 보이며, 반전 하락의 위험에 직면할 수 있다.
-
전략은 더 많은 지표를 사용하고, 파라미터를 최적화하고 전략을 테스트하는 것이 더 어렵습니다.
위와 같은 위험을 위해, 포지션 보유 시간을 적절하게 조정, 스톱 로드 라인을 설정, 최적화 매개 변수 등의 방법을 통해 제어 할 수 있다.
전략 최적화 방향
-
더 긴 주기 브린 밴드 파라미터를 테스트하여 거래 빈도를 낮추십시오.
-
MACD 속속 평균선 변수를 최적화하여 지표의 민감도를 높인다.
-
KDJ, RSI 등과 같은 다른 지표 필터를 추가하여 신호 품질을 향상시킵니다.
-
다이내믹 스톱로스, 자동 스톱로스 탈퇴, 단일 거래 위험을 제어한다.
요약하다
이 전략은 브린 벨트 돌파 거래와 MACD 지표 필터를 통합하여 이론적으로 고품질의 거래 신호를 생성할 수 있다. 변수 최적화 및 위험 제어 수단으로 더 나은 피드백 결과를 얻을 수 있다. 그러나 어떤 전략도 손실을 완전히 피할 수 없으며 실제 거래 효과를 신중하게 평가해야 한다.
- 1