모멘텀 트레이딩: 더블 이동 평균 크로스오버 전략

1
Follow
1782
Followers
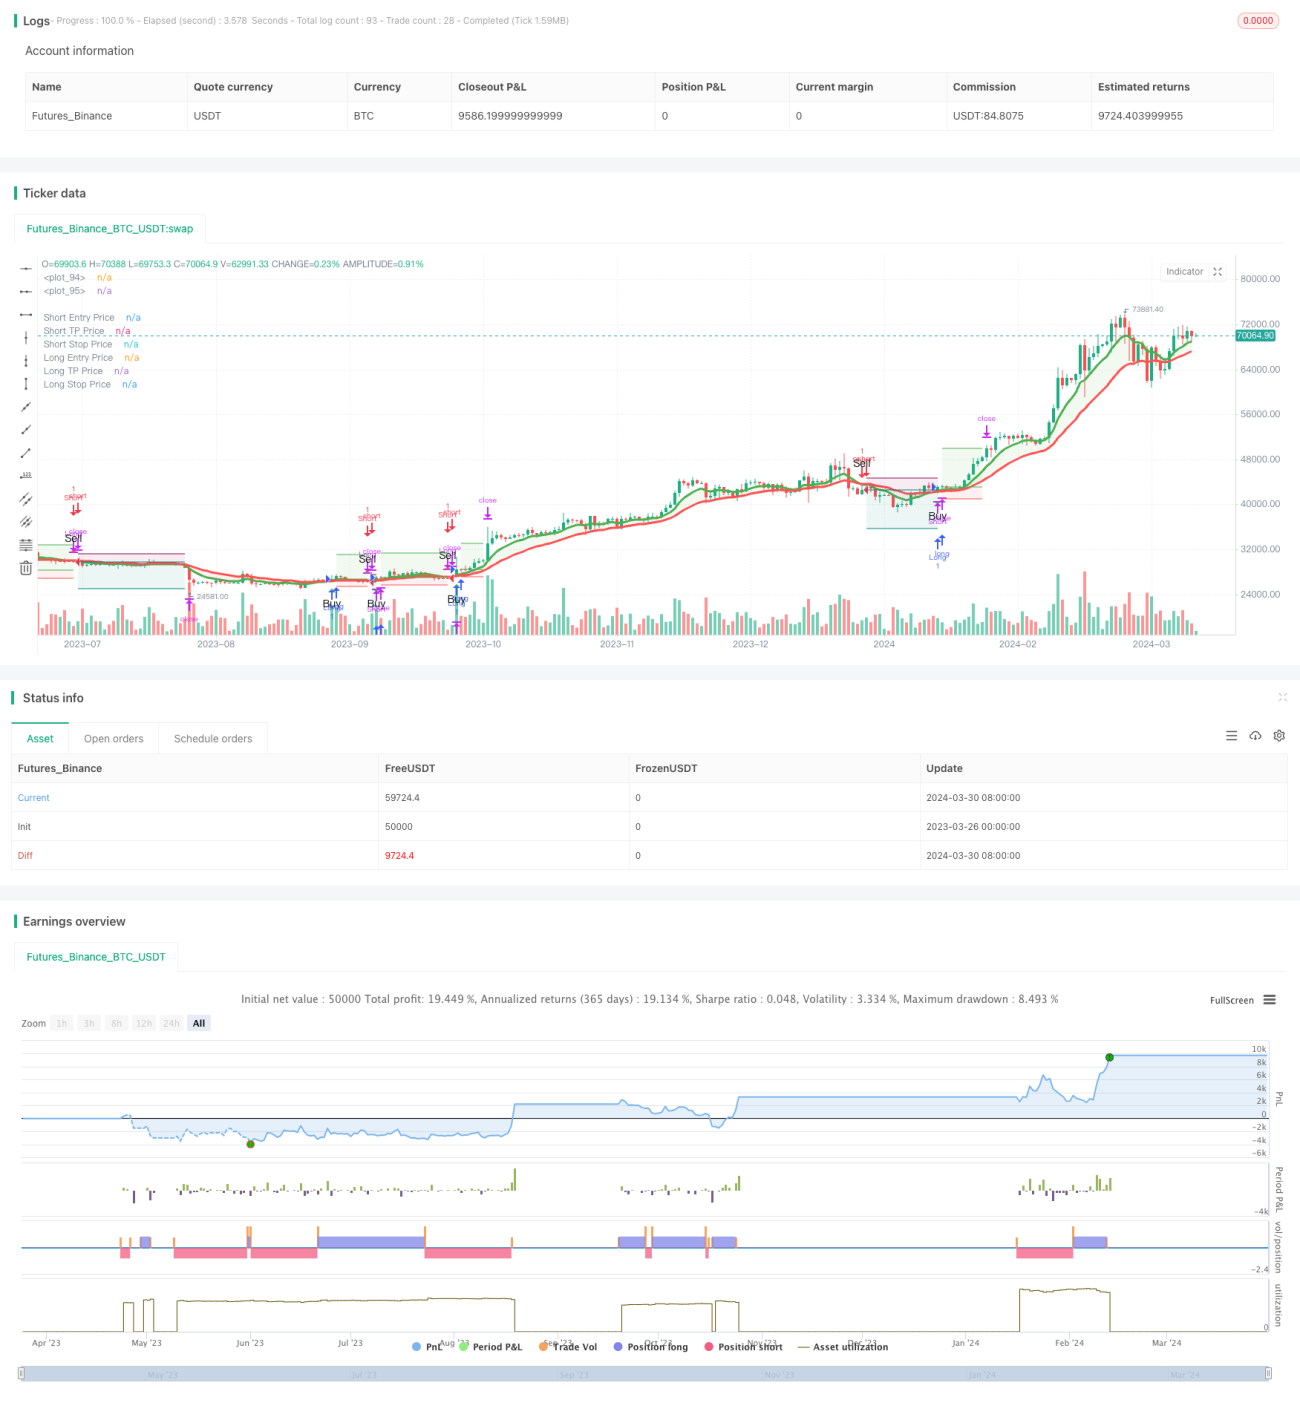
개요
이 전략은 8주기 및 21주기 지수 이동 평균 ((EMA) 를 사용하여 시장 추세의 변화를 식별한다. 더 짧은 기간의 EMA가 더 긴 기간의 EMA를 가로지르면 구매 신호가 발생한다. 반대로 더 짧은 기간의 EMA가 더 긴 기간의 EMA를 가로지르면 판매 신호가 발생한다. 이 전략은 또한 3개의 연속적으로 더 높은 낮은 점 ((HLL) 와 3개의 연속적으로 더 낮은 높은 점 ((LLH) 을 결합하여 추세 반전의 신호를 추가적으로 확인한다.
전략 원칙
- 8주기 및 21주기 EMA를 계산하여 주요 트렌드 방향을 식별한다.
- 3개의 연속적으로 더 높은 낮은 점 ((HLL) 와 3개의 연속적으로 더 낮은 높은 점 ((LLH) 을 식별하여 트렌드 반전의 초기 신호로 사용한다.
- 8주기 EMA가 아래에서 21주기 EMA를 통과하고 HLL이 뚫리면 구매 신호가 발생한다. 8주기 EMA가 위에서 21주기 EMA를 통과하고 LLH이 뚫리면 판매 신호가 발생한다.
- 스톱로스 레벨은 입시 가격의 5%로, 스톱<unk> 레벨은 입시 가격의 16%로 설정하여 위험을 통제하고 수익을 잠금합니다.
- 역전 신호가 있을 때, 포지션을 청산하고 역전 포지션을 열어야 한다.
전략적 이점
- EMA와 가격 행동 패턴 ((HLL와 LLH) 을 결합하여 트렌드를 확인하고 신호의 신뢰성을 향상시킵니다.
- 명확한 스톱로스 및 스톱<unk> 레벨을 설정하여 위험을 통제하고 수익을 고정하는 데 도움이됩니다.
- 여러 시간 프레임과 다른 시장에 적용할 수 있고, 어느 정도 보편성을 갖는다.
- 논리적으로 명확하고, 이해하기 쉽고, 실행하기 쉽습니다.
전략적 위험
- 흔들리는 시장에서, 자주 교차하는 것은 여러번의 잘못된 신호로 이어져 손실을 초래할 수 있다.
- 고정된 중지 및 중지 수준은 다른 시장 환경에 적합하지 않을 수 있으며 잠재적인 기회 비용 또는 더 큰 손실을 초래할 수 있습니다.
- 전략은 역사적 데이터에 의존하고, 급격한 사건이나 근본적인 변화에 대한 적응력이 떨어질 수 있다.
전략 최적화 방향
- 변동률 (ATR과 같은) 에 기반한 자율적 중지 및 중지 메커니즘을 도입하여 다른 시장 상황에 더 잘 적응하기 위해 중지 및 중지 수준을 조정합니다.
- 거래량, 상대 강도 (RSI) 등과 같은 다른 지표 또는 요소와 결합하여 신호를 더욱 필터링하고 신뢰성을 향상시킵니다.
- 매개 변수 (EMA 주기, 스톱 스톱 비율 등) 를 최적화하여 특정 시장 또는 지표에서 가장 잘 작동하는 매개 변수 조합을 찾습니다.
- 단편 거래의 리스크 <unk>을 제어하기 위해 포지션 사이징과 같은 리스크 관리 조치를 도입하는 것을 고려하십시오.
요약하다
이 전략은 8주기 및 21주기 EMA의 교차, HLL 및 LLH 가격 모형과 결합하여 트렌드 반전을 식별하고 거래 신호를 생성합니다. 명확한 스톱 <unk> 규칙은 위험을 제어하고 수익을 잠금하는 데 도움이됩니다. 그러나이 전략은 불안한 시장에서 거짓 신호를 생성 할 수 있으며 고정된 스톱 <unk> 수준은 다른 시장 환경에 적응하지 않을 수 있습니다.
Source
Pine
/*backtest
start: 2023-03-26 00:00:00
end: 2024-03-31 00:00:00
period: 1d
basePeriod: 1h
exchanges: [{"eid":"Futures_Binance","currency":"BTC_USDT"}]
*/

//@version=5
strategy('Trend Following 8&21EMA with strategy tester [ukiuro7]', overlay=true, process_orders_on_close=true, calc_on_every_tick=true, initial_capital = 10000)

//INPUTSStrategy parameters
Related strategies
Comment
All comments (0)
No data
- 1