Strategi Anak Panah Silang Purata Bergerak Berganda

Gambaran keseluruhan
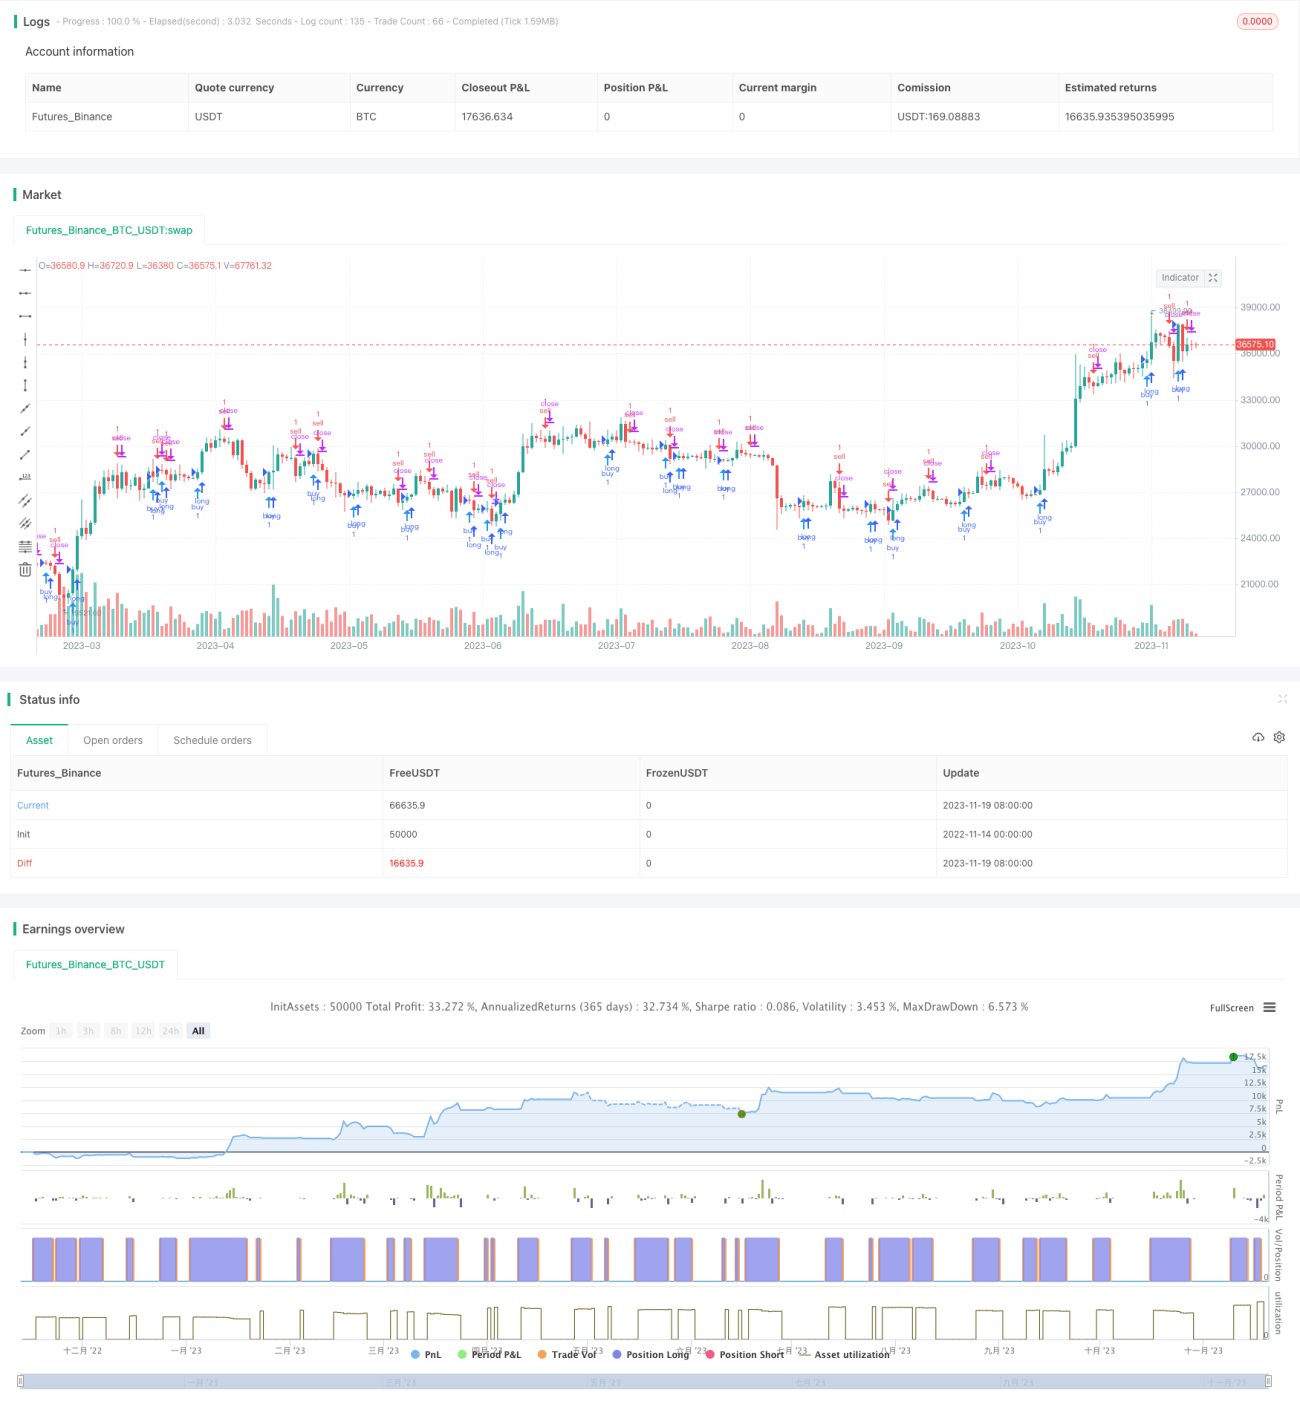
Strategi ini menentukan masa untuk membeli dan menjual dengan mengira crossover MACD. Ia memetakan bentuk anak panah pada carta untuk memberi isyarat perdagangan.
Prinsip
Strategi ini mulakan dengan mengira garis cepat (EMA 12), garis lambat (EMA 26), dan perbezaan MACD. Kemudian, berdasarkan garis cepat dan garis lambat, dan perbezaan MACD positif-negatif, ia menilai masa membeli dan menjual:
- Sinyal beli apabila garis cepat melalui garis lambat (Goldfork) dan MACD di atas perbezaan 0
- Sinyal jual apabila garis laju di bawah melintasi garis perlahan (dead fork) dan MACD di bawah nilai 0
Untuk menyaring isyarat palsu, kod juga menilai keadaan isyarat K baris sebelumnya. Isyarat semasa hanya akan dicetuskan apabila satu K baris semasa adalah isyarat terbalik ((beli ke jual atau jual ke beli).
Selain itu, kod ini juga memaparkan gambar anak panah di K-Line untuk menunjukkan masa pembelian dan penjualan.
Kelebihan
Strategi ini mempunyai kelebihan berikut:
- Menggunakan penilaian silang dua hala yang sama untuk menyaring bunyi pasaran dengan berkesan dan mengenal pasti trend
- Penghakiman dengan perbezaan MACD dapat mengelakkan kesalahan dan kesalahan
- Menggunakan anak panah untuk memberi isyarat masa untuk membeli dan menjual, dan lebih jelas
- Peraturan-peraturan yang mudah difahami dan disalin
Risiko dan Penyelesaian
Strategi ini mempunyai beberapa risiko:
- Persaingan dua garis rata-rata mudah menghasilkan isyarat palsu yang boleh menyebabkan perdagangan berlebihan. Parameter garis rata-rata boleh disesuaikan atau syarat penapisan lain boleh ditambah untuk mengurangkan isyarat palsu
- Tidak dapat menilai pergerakan dalam trend, kemungkinan kerugian. Ini dapat dielakkan dengan menggunakan indikator trend seperti ADX
- Keadaan pembelian dan penjualan yang tetap menjadikan strategi menjadi mekanis, tidak dapat menyesuaikan diri dengan perubahan pasaran. Anda boleh mencuba kaedah penyesuaian diri seperti pembelajaran mesin untuk mengoptimumkannya
Arah pengoptimuman
Strategi ini boleh dioptimumkan dalam beberapa arah:
- Uji kombinasi parameter yang berbeza untuk mencari garis laju, garis perlahan dan parameter MACD yang terbaik
- Menambah syarat kemasukan, seperti penembusan jumlah dagangan untuk menapis isyarat
- Menambah mekanisme penangguhan kerugian untuk mengawal kerugian tunggal
- Indeks Volatiliti seperti VIX untuk menilai keutamaan risiko
- Mencuba model pembelajaran mesin untuk menggantikan peraturan tetap dan mengoptimumkan strategi yang beradaptasi
ringkaskan
Strategi panah silang dua garis sejajar ini agak mudah dan praktikal secara keseluruhan, dengan penilaian silang dua garis sejajar dan penapisan nilai perbezaan MACD, anda dapat mengenal pasti titik beli dan jual dalam trend garis tengah dan panjang, untuk mengelakkan perubahan harga yang terlewat. Petua panah juga membuat operasi lebih jelas dan jelas.
/*backtest
start: 2022-11-14 00:00:00
end: 2023-11-20 00:00:00
period: 1d
basePeriod: 1h
exchanges: [{"eid":"Futures_Binance","currency":"BTC_USDT"}]
*/

//@version=3
//Daniels stolen code
strategy(shorttitle="Daniels Stolen Code", title="Daniels Stolen Code", overlay=true, calc_on_order_fills=true, pyramiding=0)
- 1