Strategi henti rugi mengikut arah aliran berdasarkan TFO dan ATR

Gambaran keseluruhan
Strategi ini adalah satu strategi untuk mengesan trend dan menjejaki kerugian yang direka oleh Dr. John Ehlers berdasarkan Trend Flex Oscillator (TFO) dan Average True Range (ATR). Ia digunakan untuk pasaran overhead, yang membuka kedudukan overhead apabila harga berbalik selepas Oversold. Ia biasanya akan menetap dalam beberapa hari, kecuali jika ditangkap oleh pasaran beruang, di mana ia akan mempertahankan kedudukan.
Prinsip Strategi
Strategi ini menggabungkan kedua-dua indikator TFO dan ATR, membuka kedudukan tinggi apabila memenuhi syarat untuk membeli, dan posisi rendah apabila memenuhi syarat untuk menjual.
Syarat pembelian: Apabila TFO berada di bawah nilai ambang tertentu (yang menandakan terlalu kosong), dan nilai TFO pada baris K teratas adalah lebih rendah daripada garis K semasa (yang menandakan TFO berbalik naik), dan ATR adalah lebih tinggi daripada ambang turun naik yang ditetapkan (yang menandakan turun naik pasaran meningkat), memenuhi ketiga-tiga syarat ini membuka lebih banyak kedudukan.
Syarat kedudukan rata: Apabila TFO lebih tinggi daripada nilai terendah tertentu (yang bermaksud terlalu banyak kepala), dan ATR lebih tinggi daripada tetingkap yang ditetapkan, maka semua kedudukan rata akan dihapuskan. Di samping itu, strategi ini juga menetapkan tracking stop loss, dan apabila harga jatuh di bawah harga tracking stop loss yang ditetapkan, semua kedudukan rata akan dihapuskan. Pengguna boleh memilih untuk membiarkan strategi itu dihapuskan mengikut isyarat indikator, atau hanya dihentikan mengikut harga yang dihapuskan.
Strategi ini boleh membuka maksimum 15 kedudukan berganda pada masa yang sama. Parameternya boleh disesuaikan untuk tempoh masa yang berbeza.
Kelebihan Strategik
-
Gabungan trend dan turun naik untuk menentukan arah pasaran, lebih stabil. TFO dapat menangkap isyarat awal trend pecah, ATR dapat memahami masa ketika turun naik pasaran meningkat.
-
Ia mempunyai parameter jual beli dan parameter henti rugi yang boleh disesuaikan. Pengguna boleh menyesuaikan parameter mengikut pasaran untuk mencapai pengoptimuman.
-
Ia mempunyai fungsi terbina dalam untuk mengurangkan kerugian dalam keadaan yang melampau. Strategi terbina dalam adalah bahagian penting dalam perdagangan kuantitatif.
-
Sokongan untuk menambah kedudukan terbuka dan separuh kedudukan kosong, boleh meningkatkan keuntungan dengan meningkatkan kedudukan.
Risiko Strategik
-
Strategi ini hanya melakukan lebih banyak, tidak mengambil ruang, dan tidak dapat memperoleh keuntungan dalam pasaran turun. Jika berlaku pasaran beruang yang dahsyat, ia boleh menyebabkan kerugian besar.
-
Tetapan parameter yang tidak betul boleh menyebabkan perdagangan yang berlebihan atau penjualan yang kurang. Ujian berulang diperlukan untuk mencari kombinasi parameter yang terbaik.
-
Dalam keadaan yang melampau, Hentikan Kerugian mungkin tidak berkesan dan tidak dapat menghalang kerugian besar daripada berlaku. Ini adalah masalah yang mungkin dihadapi oleh semua strategi Hentikan Kerugian.
-
Ulasan tidak dapat mencerminkan sepenuhnya perdagangan dalam talian, dan keputusan dalam talian akan mempunyai perbezaan tertentu.
Pengoptimuman Strategi
-
Anda boleh mempertimbangkan untuk memasukkan garis hentian bergerak ke dalam syarat-syarat penjualan, supaya strategi dapat menghentikan kerugian tepat pada masanya dan mengawal risiko penurunan dengan berkesan.
-
Mekanisme shorting boleh diperluaskan, membuka posisi kosong apabila TFO berbalik turun dan ATR cukup besar, supaya strategi boleh digunakan untuk pasaran kosong.
-
Anda boleh menambah lebih banyak syarat penapisan, seperti perubahan jumlah transaksi, untuk mengurangkan kesan kelakuan luar biasa terhadap strategi.
-
Anda boleh menguji tetapan parameter dan hasil pengukuran untuk tempoh masa yang berbeza untuk mencari kombinasi parameter dan tempoh yang optimum.
ringkaskan
Strategi ini mengintegrasikan kelebihan analisis trend dan pemantauan turun naik untuk menentukan arah pasaran melalui gabungan indikator TFO dan ATR; menyediakan mekanisme seperti pembukaan tambahan, penutupan sebahagian, dan berhenti bergerak untuk meningkatkan keuntungan dan mengawal risiko, sesuai untuk keadaan pelbagai; dan ruang pengoptimuman yang boleh diperluaskan untuk meningkatkan prestasi strategi dengan menambahkan lebih banyak penapis indikator dan penyesuaian parameter.
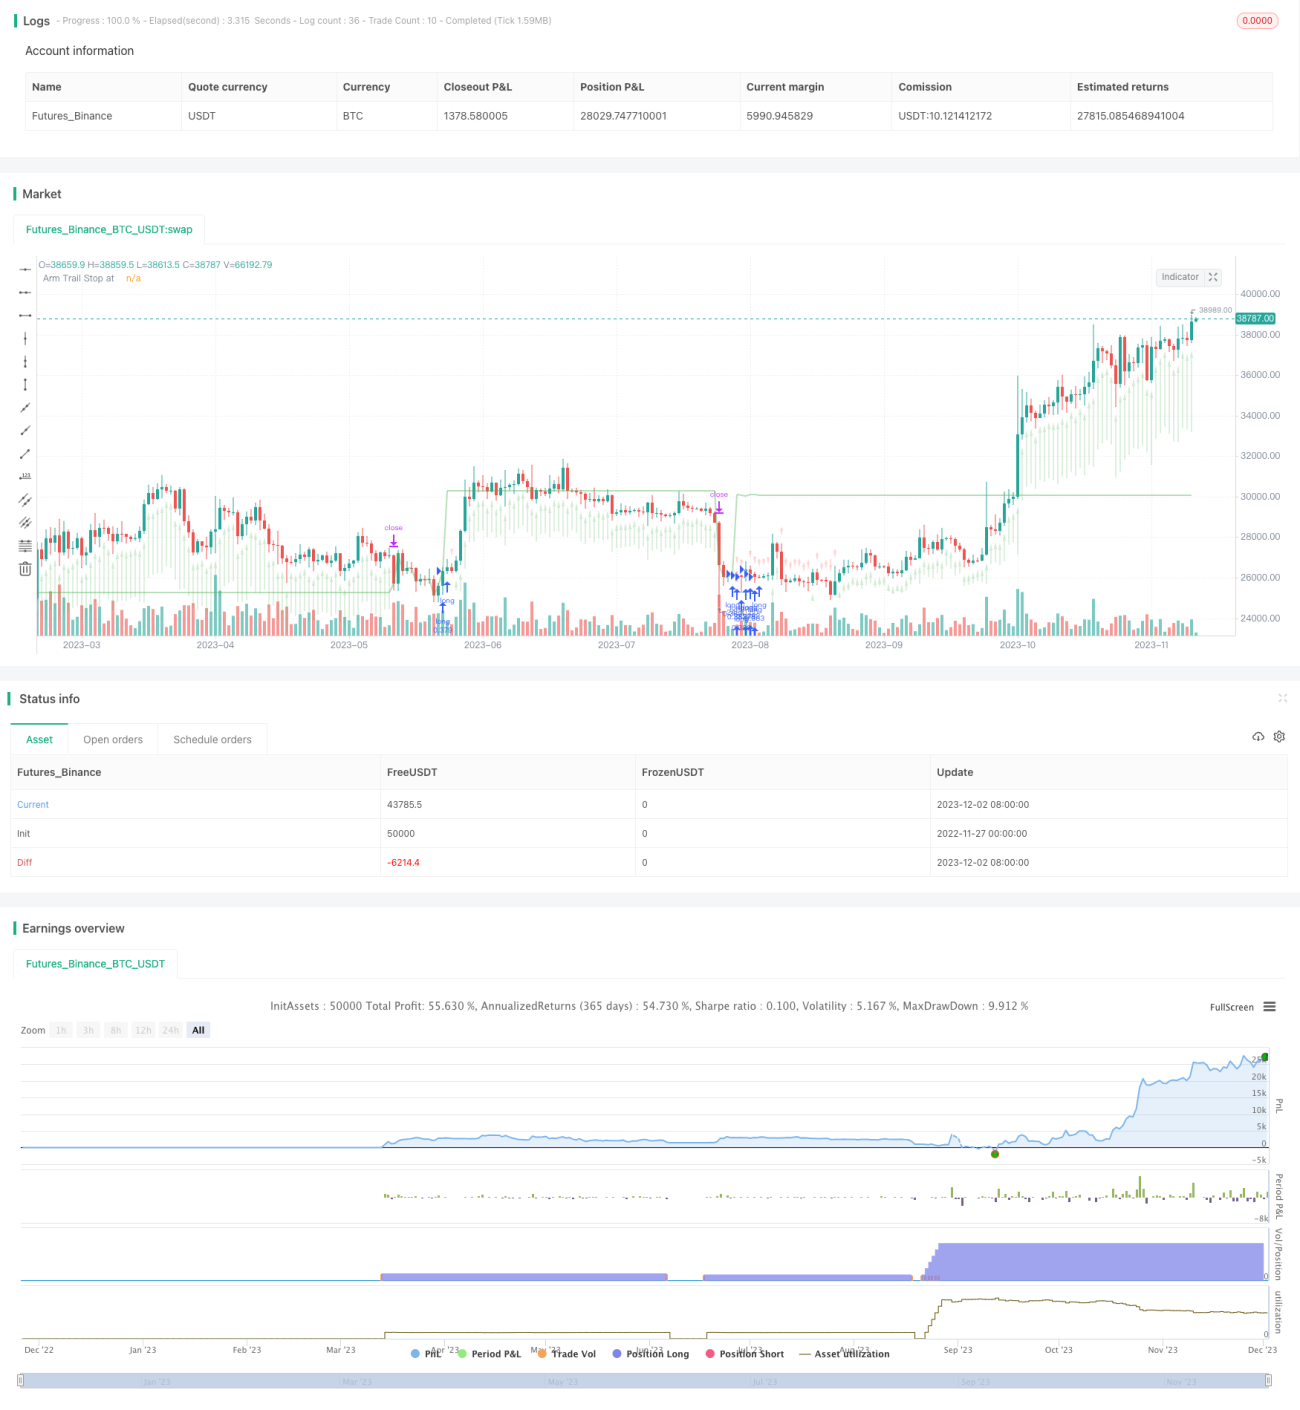
/*backtest
start: 2022-11-27 00:00:00
end: 2023-12-03 00:00:00
period: 1d
basePeriod: 1h
exchanges: [{"eid":"Futures_Binance","currency":"BTC_USDT"}]
*/

// This source code is subject to the terms of the Mozilla Public License 2.0 at https://mozilla.org/MPL/2.0/
// © Chart0bserver
//
// Open Source attributions:- 1