Strategi Lantunan Purata Pergerakan

Gambaran Keseluruhan Strategi
Strategi bouncing moving average adalah strategi yang mengesan harga untuk menembusi moving averages. Ia memeriksa apakah harga akan bouncing kembali dari bawah moving average, jika ya, itu adalah isyarat multihead; jika harga bouncing ke bawah dari arah atas moving average, itu adalah isyarat kosong.
Nama strategi
Exponential Moving Average Bounce Strategy
Prinsip Strategi
Strategi ini berdasarkan purata bergerak eksponensial. Ia akan mengira garis EMA dalam masa nyata. Ia kemudian memeriksa sama ada harga bertolak dari atas atau di bawah garis EMA:
- Jika harga jatuh di bawah EMA dan kemudian naik semula ke atas EMA, ia adalah isyarat berbilang arah.
- Jika harga mula menembusi garis EMA dan kemudian turun lagi untuk menutup di bawah garis EMA, ia adalah isyarat kosong
Ini adalah isyarat permulaan untuk strategi.
Analisis kelebihan strategi
Bergerak dengan lancar, mengelakkan terjerat
EMA hanya akan memasuki pasaran apabila ia mengesahkan bahawa harga telah berbalik dan ia tidak akan terjejas.
Pemindahan kecil, perolehan sejarah
Oleh kerana menggunakan purata bergerak indeks, data harga dapat dihaluskan dengan berkesan, memfilterkan bunyi pasaran, menjadikan strategi ini sedikit mundur, dan keuntungan sejarah lebih baik.
Mudah difahami, parameter boleh disesuaikan
Strategi EMA bouncing hanya bergantung pada purata bergerak, sangat mudah dan mudah difahami oleh pemula; sementara parameter kitaran EMA boleh disesuaikan secara fleksibel untuk menyesuaikan diri dengan pelbagai jenis.
Analisis risiko
Isyarat mudah palsu
Selalunya terdapat banyak penembusan palsu berdekatan dengan garis EMA, yang boleh menyebabkan isyarat yang salah. Parameter EMA perlu disesuaikan untuk menyaring kebisingan ini.
Operasi beransur-ansur, tidak dapat meramalkan titik perubahan
Strategi ini pada dasarnya adalah operasi surut. Tidak dapat meramalkan titik perubahan harga, hanya boleh mengejar trend. Ini mungkin kehilangan masa masuk terbaik untuk penyesuaian kitaran.
Hentikan kerosakan dengan mudah.
Hentian yang berdekatan dengan purata bergerak kadang-kadang akan ditembusi, menyebabkan kerugian meluas. Ini memerlukan penggunaan hentian yang lebih fleksibel.
Arah pengoptimuman
Gabungan dengan petunjuk lain untuk menapis isyarat
Indikator lain seperti RSI, MACD dan lain-lain boleh ditambah untuk mengesahkan harga berbalik dan menapis isyarat palsu.
Pengoptimuman Hentikan Kerosakan
Penghentian yang lebih fleksibel seperti penghentian masa, penghentian gegaran dan sebagainya boleh digunakan untuk mengurangkan risiko terjatuh.
Optimumkan parameter
Optimumkan parameter kitaran EMA untuk mencari kombinasi parameter terbaik. Anda juga boleh mengubah parameter EMA secara dinamik untuk mengesan kitaran pasaran.
ringkaskan
Strategi rebound moving average adalah strategi trend yang mudah dan praktikal. Ia berjalan lancar, pengunduran kecil, dan mudah difahami. Di samping itu, terdapat risiko isyarat palsu dan risiko berhenti.
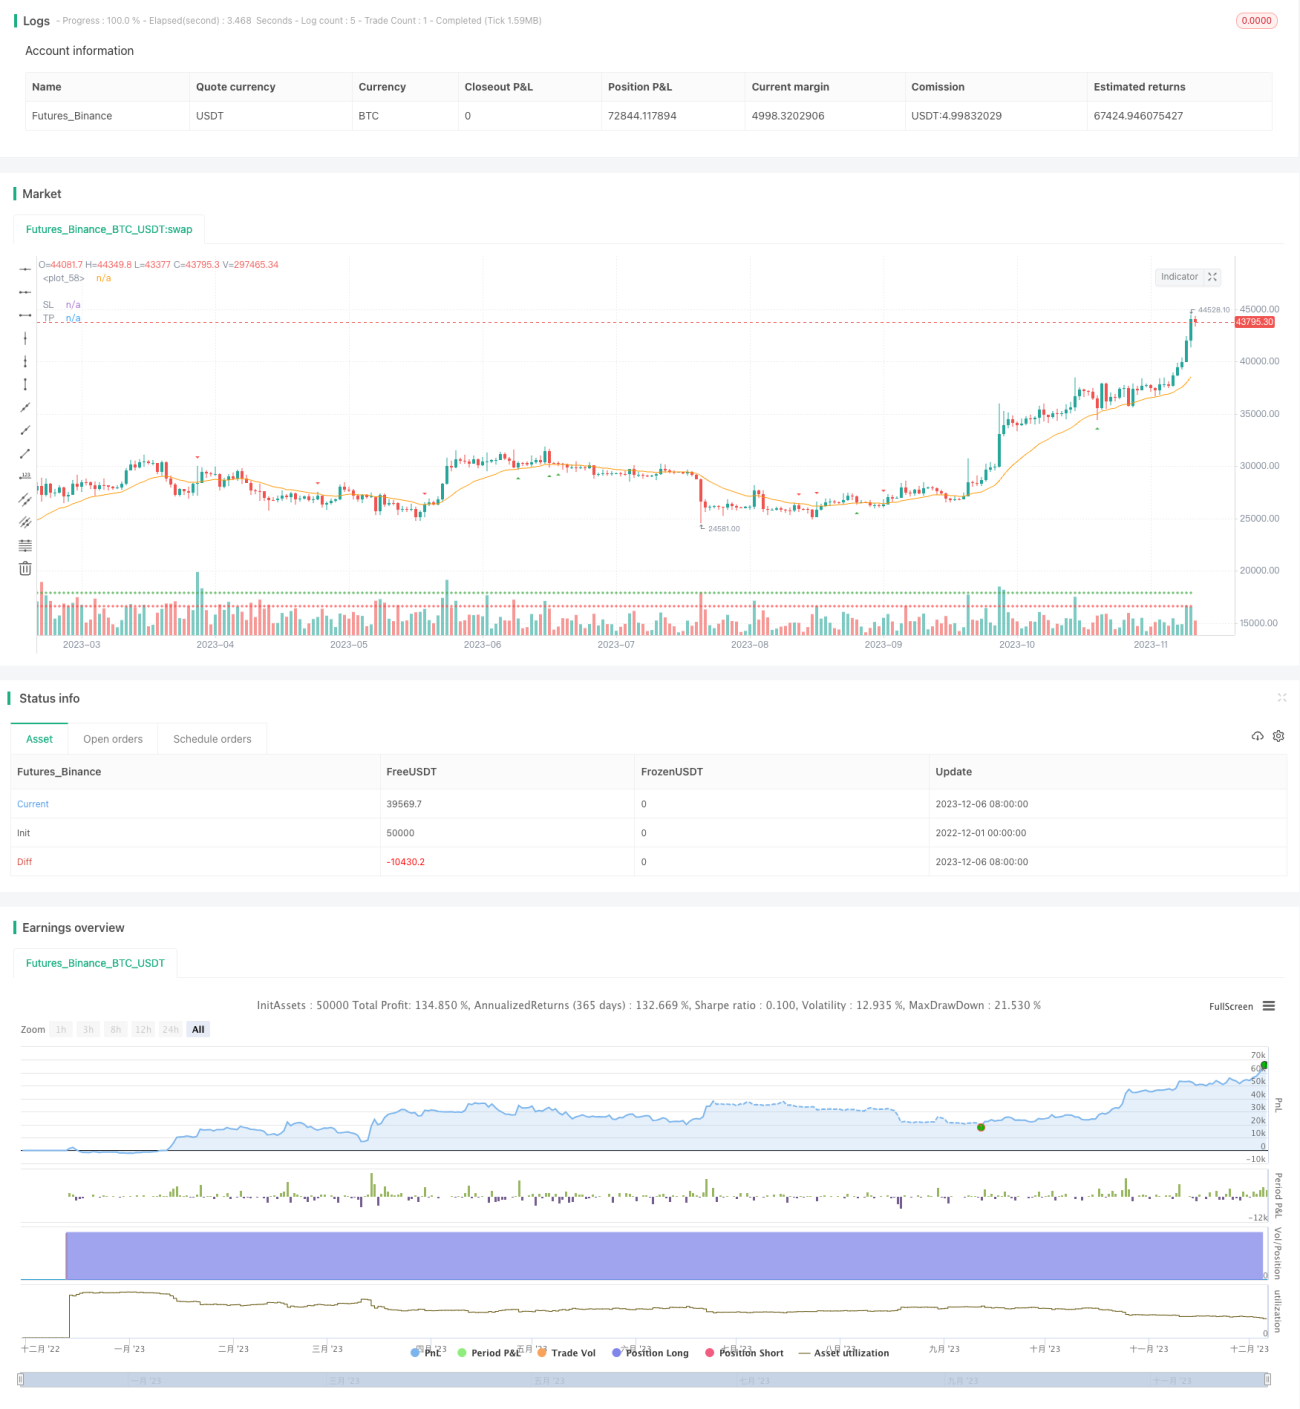
/*backtest
start: 2022-12-01 00:00:00
end: 2023-12-07 00:00:00
period: 1d
basePeriod: 1h
exchanges: [{"eid":"Futures_Binance","currency":"BTC_USDT"}]
*/

// This source code is subject to the terms of the Mozilla Public License 2.0 at https://mozilla.org/MPL/2.0/
// © tweakerID

// Simple strategy that checks for price bounces over an Exponential Moving Average. If the CLOSE of the candle bounces- 1