Strategi Mengikuti Aliran Pembalikan Berganda


Tarikh penciptaan: 2023-12-13 18:01:53 Akhirnya diubah suai: 2023-12-13 18:01:53
Salin: 0 Bilangan klik: 575
1
fokus pada
1621
Pengikut

Strategi Mengikuti Aliran Pembalikan Berganda

Gambaran keseluruhan

Ini adalah strategi pengesanan trend yang menggabungkan isyarat pembalikan ganda. Ia mengintegrasikan strategi 123 pembalikan dan strategi indeks prestasi untuk mengesan titik pembalikan harga dan membuat penilaian trend yang lebih dipercayai.

Prinsip Strategi

Strategi ini terdiri daripada dua sub-strategi:

  1. 123 Strategi berbalik

Menggunakan garis K 14 hari untuk menilai isyarat pembalikan. Peraturan khusus adalah:

  • Isyarat multi-kepala: harga penutupan dua hari sebelumnya turun, harga penutupan K Line semasa lebih tinggi daripada harga penutupan hari sebelumnya, Stochastic Slow hari ke-9 di bawah 50
  • Isyarat kosong: harga penutupan dua hari sebelumnya meningkat, harga penutupan K Line semasa lebih rendah daripada harga penutupan hari sebelumnya, 9 hari Stochastic Fast lebih tinggi daripada 50
  1. Strategi Indeks Prestasi

Mengambil kenaikan dan penurunan dalam tempoh 14 hari sebagai penunjuk. Peraturan adalah:

  • Indeks prestasi> ((0)), menghasilkan isyarat berbilang kepala
  • Indeks prestasi <(0), menghasilkan isyarat kosong

Isyarat akhir adalah gabungan dua jenis isyarat. Iaitu, isyarat polygonal yang sama arah diperlukan untuk menghasilkan operasi jual beli yang sebenar.

Ini boleh menapis sebahagian daripada bunyi bising, menjadikan isyarat lebih dipercayai.

Kelebihan Strategik

Sistem ini mempunyai kelebihan berikut:

  1. Pengkajian dua faktor menjadikan isyarat lebih dipercayai
  2. Ia boleh menyaring bunyi pasaran dengan berkesan dan mengelakkan isyarat palsu.
  3. 123 bentuk klasik dan praktikal, mudah dinilai dan diulang semula
  4. Indeks Prestasi boleh menilai trend masa depan
  5. Kombinasi parameter fleksibel dan boleh dioptimumkan lebih jauh

Risiko Strategik

Strategi ini mempunyai beberapa risiko:

  1. Mungkin terlewatkan perubahan mendadak dan tidak dapat menangkap trend sepenuhnya
  2. Kombinasi dua syarat menyebabkan kurang isyarat dan mungkin menjejaskan keuntungan
  3. Keperluan untuk penilaian seimbang, mudah terjejas oleh turun naik saham individu
  4. Masalah parameter mungkin menyebabkan isyarat yang tidak betul

Beberapa aspek yang boleh dipertimbangkan untuk dioptimumkan:

  1. Menyesuaikan parameter seperti K-panjang, kitaran stokastik dan sebagainya
  2. Mengoptimumkan logik penghakiman isyarat berganda
  3. Menggabungkan faktor-faktor lain, seperti jumlah penghantaran.
  4. Meningkatkan mekanisme kawalan kerugian

ringkaskan

Strategi ini mengintegrasikan penghakiman double reversal, yang dapat mengesan titik-titik perubahan harga secara berkesan. Walaupun kebarangkalian isyarat berkurangan, tetapi kebolehpercayaan yang tinggi, sesuai untuk menangkap trend garis tengah yang panjang. Kesan strategi dapat ditingkatkan lagi melalui penyesuaian parameter dan pengoptimuman pelbagai faktor.
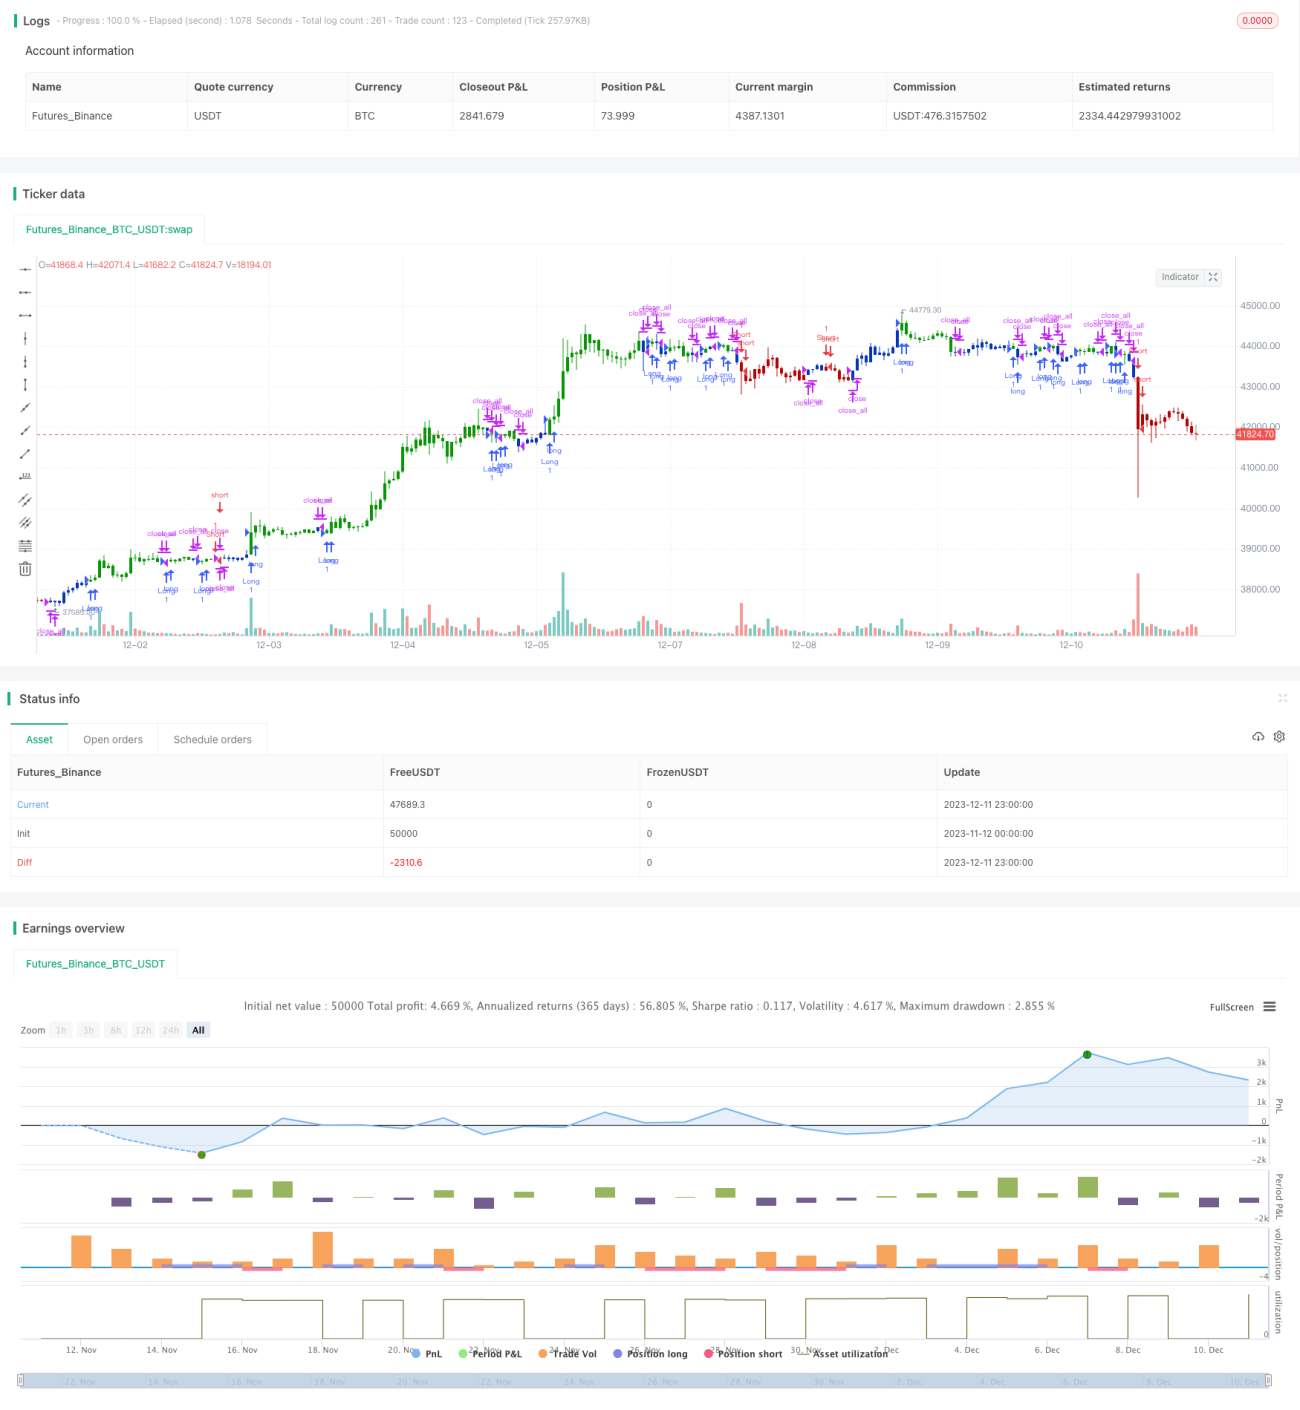
Kod sumber strategi
/*backtest
start: 2023-11-12 00:00:00
end: 2023-12-12 00:00:00
period: 1h
basePeriod: 15m
exchanges: [{"eid":"Futures_Binance","currency":"BTC_USDT"}]
*/

//@version=4
////////////////////////////////////////////////////////////
//  Copyright by HPotter v1.0 15/04/2021
// This is combo strategies for get a cumulative signal. 
//
// First strategy
// This System was created from the Book "How I Tripled My Money In The 
// Futures Market" by Ulf Jensen, Page 183. This is reverse type of strategies.
// The strategy buys at market, if close price is higher than the previous close 
// during 2 days and the meaning of 9-days Stochastic Slow Oscillator is lower than 50. 
// The strategy sells at market, if close price is lower than the previous close price 
// during 2 days and the meaning of 9-days Stochastic Fast Oscillator is higher than 50.
//
// Second strategy
// The Performance indicator or a more familiar term, KPI (key performance indicator), 
// is an industry term that measures the performance. Generally used by organizations, 
// they determine whether the company is successful or not, and the degree of success. 
// It is used on a business’ different levels, to quantify the progress or regress of a 
// department, of an employee or even of a certain program or activity. For a manager 
// it’s extremely important to determine which KPIs are relevant for his activity, and 
// what is important almost always depends on which department he wants to measure the 
// performance for.  So the indicators set for the financial team will be different than 
// the ones for the marketing department and so on.
//
// Similar to the KPIs companies use to measure their performance on a monthly, quarterly 
// and yearly basis, the stock market makes use of a performance indicator as well, although 
// on the market, the performance index is calculated on a daily basis. The stock market 
// performance indicates the direction of the stock market as a whole, or of a specific stock 
// and gives traders an overall impression over the future security prices, helping them decide 
// the best move. A change in the indicator gives information about future trends a stock could 
// adopt, information about a sector or even on the whole economy. The financial sector is the 
// most relevant department of the economy and the indicators provide information on its overall 
// health, so when a stock price moves upwards, the indicators are a signal of good news. On the 
// other hand, if the price of a particular stock decreases, that is because bad news about its 
// performance are out and they generate negative signals to the market, causing the price to go 
// downwards. One could state that the movement of the security prices and consequently, the movement 
// of the indicators are an overall evaluation of a country’s economic trend.
//
// WARNING:
// - For purpose educate only
// - This script to change bars colors.
////////////////////////////////////////////////////////////
Reversal123(Length, KSmoothing, DLength, Level) =>
    vFast = sma(stoch(close, high, low, Length), KSmoothing) 
    vSlow = sma(vFast, DLength)
    pos = 0.0
    pos := iff(close[2] < close[1] and close > close[1] and vFast < vSlow and vFast > Level, 1,
	         iff(close[2] > close[1] and close < close[1] and vFast > vSlow and vFast < Level, -1, nz(pos[1], 0))) 
	pos


PI(Period) =>
    pos = 0.0
    xKPI = (close - close[Period]) * 100 / close[Period]
    pos := iff(xKPI > 0, 1,
              iff(xKPI < 0, -1, nz(pos[1], 0))) 
    pos

strategy(title="Combo Backtest 123 Reversal & Perfomance index", shorttitle="Combo", overlay = true)
line1 = input(true, "---- 123 Reversal ----")
Length = input(14, minval=1)
KSmoothing = input(1, minval=1)
DLength = input(3, minval=1)
Level = input(50, minval=1)
//-------------------------
line2 = input(true, "---- Perfomance index ----")
Period = input(14, minval=1)
reverse = input(false, title="Trade reverse")
posReversal123 = Reversal123(Length, KSmoothing, DLength, Level)
posPI = PI(Period)
pos = iff(posReversal123 == 1 and posPI == 1 , 1,
	   iff(posReversal123 == -1 and posPI == -1, -1, 0)) 
possig = iff(reverse and pos == 1, -1,
          iff(reverse and pos == -1 , 1, pos))	   
if (possig == 1 ) 
    strategy.entry("Long", strategy.long)
if (possig == -1 )
    strategy.entry("Short", strategy.short)	 
if (possig == 0) 
    strategy.close_all()
barcolor(possig == -1 ? #b50404: possig == 1 ? #079605 : #0536b3 )