Strategi pembalikan titik rendah


Tarikh penciptaan: 2023-12-15 11:07:41 Akhirnya diubah suai: 2023-12-15 11:07:41
Salin: 0 Bilangan klik: 659
1
fokus pada
1621
Pengikut

Strategi pembalikan titik rendah

Gambaran keseluruhan

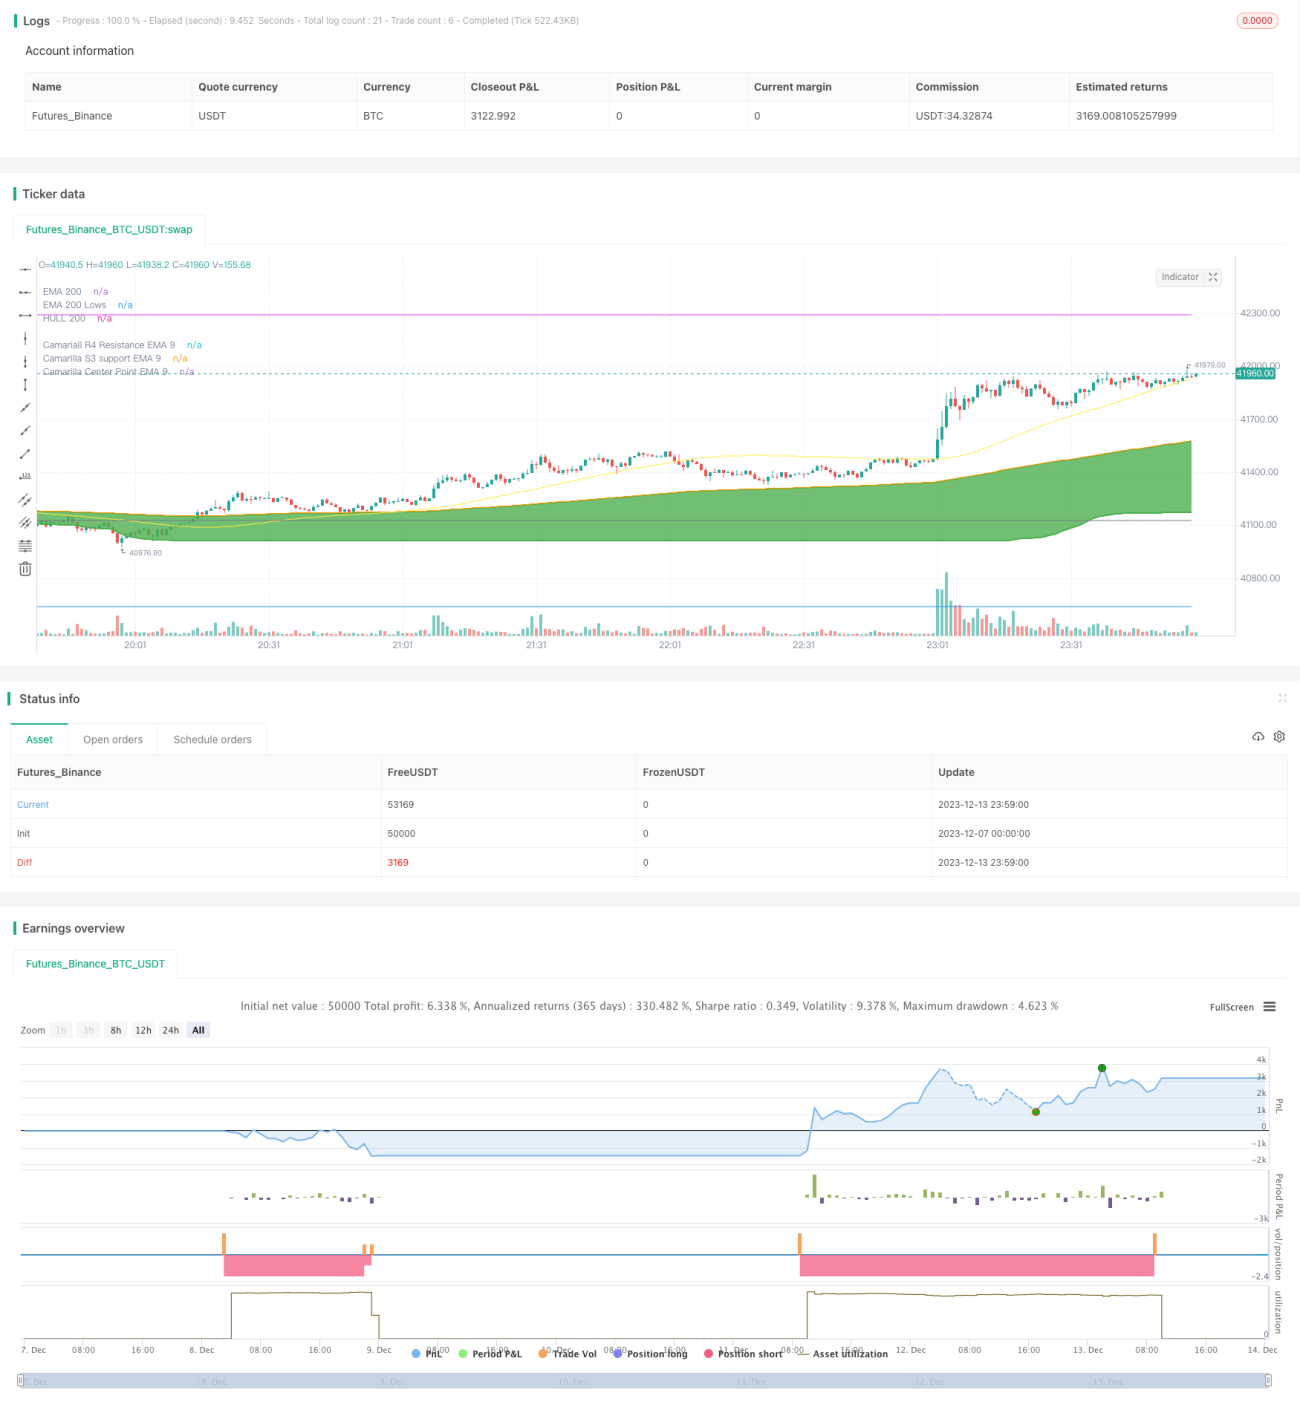
Strategi ini adalah strategi untuk melakukan operasi pembalikan berdasarkan titik terendah pasaran. Ia menggunakan titik terendah EMA 200 hari, digabungkan dengan titik rintangan sokongan Camellia untuk menentukan titik terendah pasaran, dan melakukan lebih banyak operasi apabila harga bangkit.

Prinsip Strategi

  1. Kira harga minimum EMA 200 hari EMA200Lows, yang dianggap berada di sekitar titik terendah pasaran apabila harga ditutup di bawah EMA tersebut.
  2. Hitung EMA 9 hari untuk sokongan 3 ((S3) di Camaleira, iaitu ema_s3_9, sebagai sokongan penting.
  3. Kemudian kira EMA 9 hari di pusat Camarela, atau ema_center_9, sebagai isyarat untuk menilai pembalikan.
  4. Apabila ema_center_9 memakai ema200Lows, dan 3 baris K terdahulu adalah lebih rendah daripada ema200Lows, lakukan beberapa operasi.
  5. Stop loss adalah stop loss ATR dan mengesan pergerakan harga minimum.
  6. Target keuntungan ialah ema_h4_9 ((Camelera Resistance4) dan ema_s3_9 ((Camelera Support3)

Analisis kelebihan

  1. Menggunakan EMA 200 hari untuk menentukan kawasan pasaran terendah, dan mengelakkan lebih rendah di tengah-tengah.
  2. Di samping itu, ia juga boleh digunakan untuk mengesan titik balik dengan lebih tepat apabila ia digabungkan dengan pusat.
  3. ATR Stop Loss adalah kaedah untuk menghentikan kerugian dengan lebih munasabah, menjejaki titik rendah yang lebih baik dan mengunci lebih banyak mata wang.

Analisis risiko

  1. Ia adalah strategi yang lebih sesuai untuk operasi garis pendek.
  2. Dalam keadaan yang baik, kerugian berhenti mungkin lebih besar. Ia boleh disesuaikan dengan parameter ATR.
  3. Di samping itu, ia juga menunjukkan bahawa penghakiman terbalik Camarela tidak semestinya 100 peratus tepat, dan ia boleh menyebabkan kesalahan penghakiman.

Arah pengoptimuman

  1. Anda boleh mempertimbangkan untuk menilai isyarat pembalikan dalam kombinasi dengan petunjuk lain, seperti RSI.
  2. Anda boleh mengkaji penyesuaian parameter yang berbeza untuk mencari parameter yang lebih baik.
  3. Anda boleh mencuba kaedah pembelajaran mesin untuk secara dinamik menyesuaikan ATR.

ringkaskan

Strategi ini menggunakan titik terendah EMA dengan penunjuk Camerella untuk menentukan kawasan terendah dan titik balik pasaran. Mengambil keuntungan melalui hentian ATR. Secara keseluruhan, strategi ini lebih lengkap dan mempunyai nilai pertempuran tertentu. Dengan pengoptimuman lanjut pada masa akan datang, strategi ini dapat dibuat lebih stabil dan boleh dipercayai.

Kod sumber strategi
/*backtest
start: 2023-12-07 00:00:00
end: 2023-12-14 00:00:00
period: 1m
basePeriod: 1m
exchanges: [{"eid":"Futures_Binance","currency":"BTC_USDT"}]
*/

// This source code is subject to the terms of the Mozilla Public License 2.0 at https://mozilla.org/MPL/2.0/
// © mohanee

//Using the lowest of low of ema200, you can find the bottom
//wait for price to close below ema200Lows line
//when pivot

//@version=4
strategy(title="PickingupFromBottom Strategy", overlay=true )  //default_qty_value=10, default_qty_type=strategy.fixed, 

//HMA
HMA(src1, length1) =>  wma(2 * wma(src1, length1/2) - wma(src1, length1), round(sqrt(length1)))


//variables BEGIN
length1=input(200,title="EMA 1 Length")   
length2=input(50,title="EMA 2 Length")   
length3=input(20,title="EMA 3 Length")   

sourceForHighs= input(hlc3, title="Source for Highs", type=input.source)
sourceForLows = input(hlc3, title="Source for Lows" , type=input.source)

hiLoLength=input(7, title="HiLo Band Length")

atrLength=input(14, title="ATR Length")
atrMultiplier=input(3.5, title="ATR Multiplier")

//takePartialProfits = input(true, title="Take Partial Profits (if this selected, RSI 13 higher reading over 80 is considered for partial closing ) ")


ema200=ema(close,length1)
hma200=HMA(close,length1)


////Camarilla pivot points
//study(title="Camarilla Pivots", shorttitle="Camarilla", overlay=true)
t = input(title = "Pivot Resolution", defval="D", options=["D","W","M"])

//Get previous day/week bar and avoiding realtime calculation by taking the previous to current bar
sopen = security(syminfo.tickerid, t, open[1], barmerge.gaps_off, barmerge.lookahead_on)
shigh = security(syminfo.tickerid, t, high[1], barmerge.gaps_off, barmerge.lookahead_on)
slow = security(syminfo.tickerid, t, low[1], barmerge.gaps_off, barmerge.lookahead_on)
sclose = security(syminfo.tickerid, t, close[1], barmerge.gaps_off, barmerge.lookahead_on)
r = shigh-slow

//Calculate pivots
//center=(sclose)
//center=(close[1] + high[1] + low[1])/3
center=sclose - r*(0.618)

h1=sclose + r*(1.1/12)
h2=sclose + r*(1.1/6)
h3=sclose + r*(1.1/4)
h4=sclose + r*(1.1/2)
h5=(shigh/slow)*sclose
l1=sclose - r*(1.1/12)
l2=sclose - r*(1.1/6)
l3=sclose - r*(1.1/4)
l4=sclose - r*(1.1/2)
l5=sclose - (h5-sclose)

//Colors (<ternary conditional operator> expression prevents continuous lines on history)
c5=sopen != sopen[1] ? na : color.red
c4=sopen != sopen[1] ? na : color.purple
c3=sopen != sopen[1] ? na : color.fuchsia
c2=sopen != sopen[1] ? na : color.blue
c1=sopen != sopen[1] ? na : color.gray
cc=sopen != sopen[1] ? na : color.blue

//Plotting
//plot(center, title="Central",color=color.blue, linewidth=2)
//plot(h5, title="H5",color=c5, linewidth=1)
//plot(h4, title="H4",color=c4, linewidth=2)
//plot(h3, title="H3",color=c3, linewidth=1)
//plot(h2, title="H2",color=c2, linewidth=1)
//plot(h1, title="H1",color=c1, linewidth=1)
//plot(l1, title="L1",color=c1, linewidth=1)
//plot(l2, title="L2",color=c2, linewidth=1)
//plot(l3, title="L3",color=c3, linewidth=1)
//plot(l4, title="L4",color=c4, linewidth=2)
//plot(l5, title="L5",color=c5, linewidth=1)////Camarilla pivot points

ema_s3_9=ema(l3, 9)
ema_s3_50=ema(l3, 50)
ema_h4_9=ema(h4, 9)

ema_center_9=ema(center, 9)


plot(ema_h4_9, title="Camariall R4 Resistance EMA 9", color=color.fuchsia)
plot(ema_s3_9, title="Camarilla S3 support EMA 9", color=color.gray, linewidth=1)

//plot(ema_s3_50, title="Camarilla S3 support EMA 50", color=color.green, linewidth=2)

plot(ema_center_9, title="Camarilla Center Point EMA 9", color=color.blue)


plot(hma200, title="HULL 200", color=color.yellow,  transp=25)
plotEma200=plot(ema200, title="EMA 200",  style=plot.style_linebr, linewidth=2 , color=color.orange)

ema200High = ema(highest(sourceForHighs,length1), hiLoLength)
ema200Low= ema(lowest(sourceForLows,length1), hiLoLength)

ema50High = ema(highest(sourceForHighs,length2), hiLoLength)
ema50Low= ema(lowest(sourceForLows,length2), hiLoLength)

ema20High = ema(highest(sourceForHighs,length3), hiLoLength)
ema20Low= ema(lowest(sourceForLows,length3), hiLoLength)

//plot(ema200High, title="EMA 200 Highs", linewidth=2, color=color.orange, transp=30)
plotEma200Low=plot(ema200Low, title="EMA 200 Lows", linewidth=2, color=color.green, transp=30, style=plot.style_linebr)

//plot(ema50High, title="EMA 50 Highs", linewidth=2, color=color.blue, transp=30)
//plotEma50Low=plot(ema50Low, title="EMA 50 Lows", linewidth=2, color=color.blue, transp=30)


fill(plotEma200, plotEma200Low, color=color.green )


// Drawings /////////////////////////////////////////


//Highlight when centerpont crossing up ema200Low a
ema200LowBuyColor=color.new(color.green, transp=50)
bgcolor(crossover(ema_center_9,ema200Low) and (close[1]<ema200Low or close[2]<ema200Low or close[3]<ema200Low)? ema200LowBuyColor : na)
//ema200LowBuyCondition= (close[1]<ema200Low or close[2]<ema200Low or close[3]<ema200Low)
strategy.entry(id="ema200Low Buy", comment="LE2", qty=2, long=true,  when= crossover(ema_center_9,ema200Low) and (close[1]<ema200Low or close[2]<ema200Low or close[3]<ema200Low) )  //or (close>open and low<ema20Low and close>ema20Low) ) )     //  // aroonOsc<0


//Trailing StopLoss
////// Calculate trailing SL
/////////////////////////////////////////////////////
sl_val = atrMultiplier * atr(atrLength)


trailing_sl = 0.0
//trailing_sl :=   max(low[1]  - sl_val, nz(trailing_sl[1])) 
trailing_sl :=   strategy.position_size>=1 ?  max(low  - sl_val, nz(trailing_sl[1])) :  na

//draw initil stop loss
//plot(strategy.position_size>=1 ? trailing_sl : na, color = color.blue , style=plot.style_linebr,  linewidth = 2, title = "stop loss")
plot(trailing_sl, title="ATR Trailing Stop Loss", style=plot.style_linebr, linewidth=1, color=color.red, transp=30)
//Trailing StopLoss
////// Calculate trailing SL
/////////////////////////////////////////////////////


strategy.close(id="ema200Low Buy", comment="TP1="+tostring(close - strategy.position_avg_price, "####.##"), qty=1, when=abs(strategy.position_size)>=1 and crossunder(close, ema_h4_9)  )  //close<ema55 and rsi5Val<20 //ema34<ema55  //close<ema89
strategy.close(id="ema200Low Buy", comment="TP2="+tostring(close - strategy.position_avg_price, "####.##"),  qty=1, when=abs(strategy.position_size)>=1 and crossunder(close, ema_s3_9)  )  //close<ema55 and rsi5Val<20 //ema34<ema55  //close<ema89