Strategi keuntungan jangka pendek berdasarkan corak RSI V
Gambaran keseluruhan
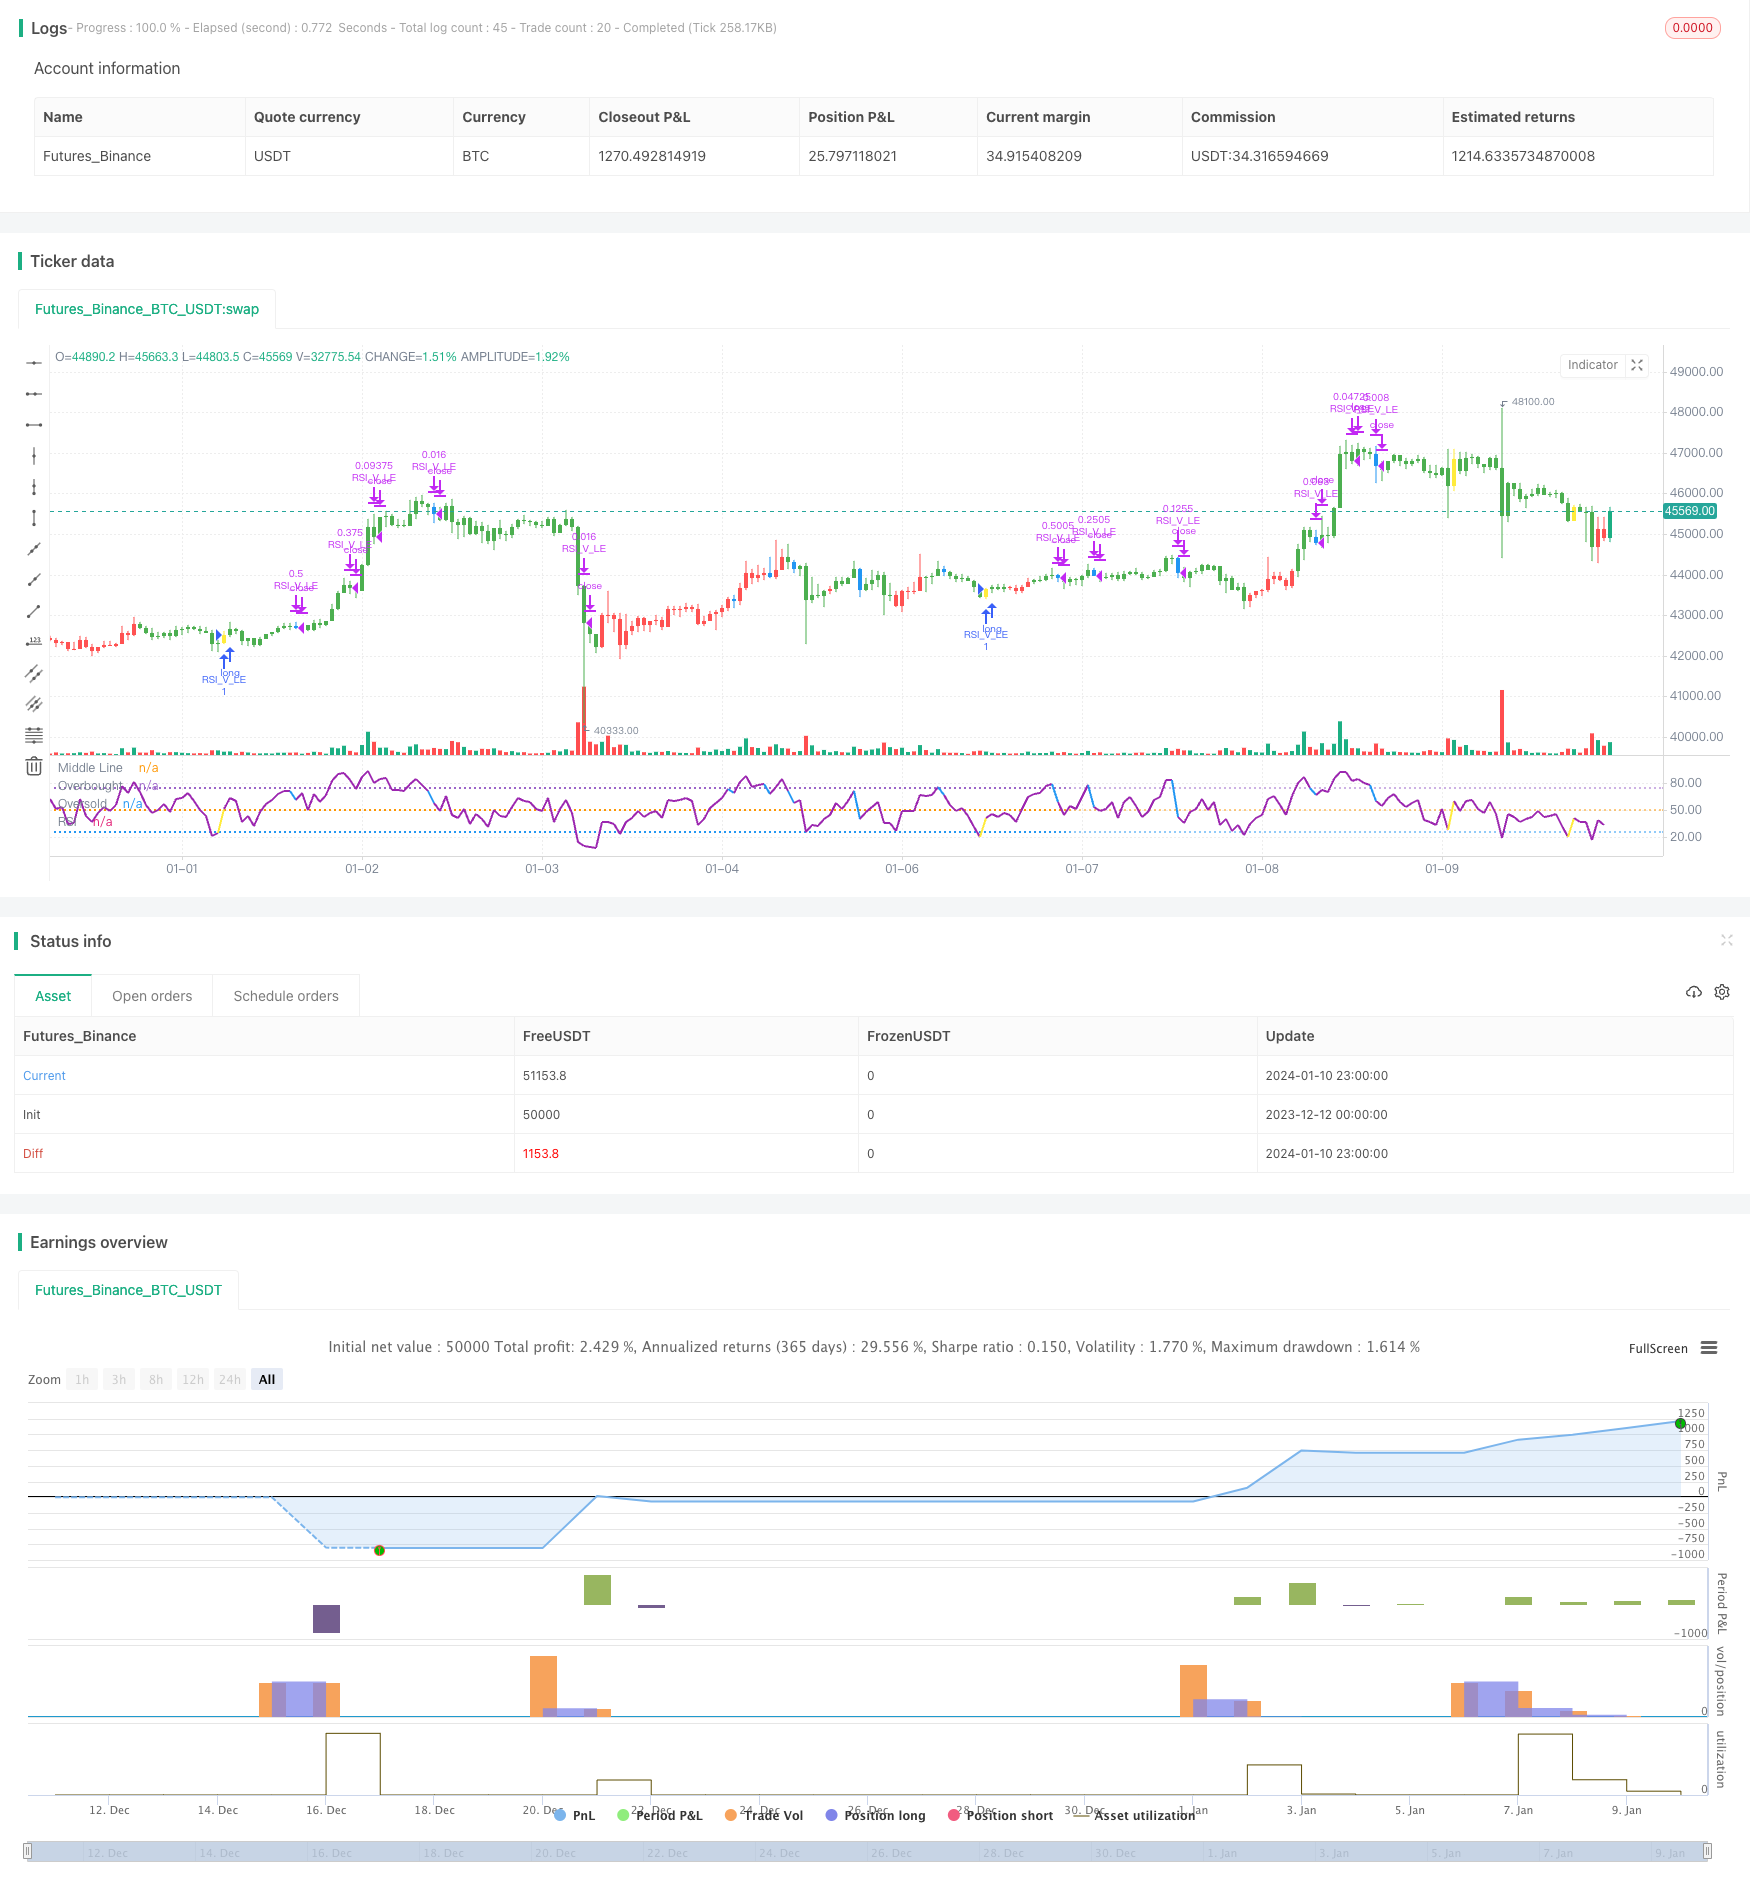
Strategi ini berdasarkan pada bentuk V RSI, dengan penapisan EMA rata-rata, membentuk strategi keuntungan garis pendek yang lebih dipercayai. Ia dapat menangkap peluang untuk membentuk rebound harga di kawasan oversold, melakukan lebih banyak dengan tepat melalui isyarat bentuk V RSI, untuk mencapai keuntungan di garis pendek.
Prinsip Strategi
- Menggunakan garis 20 hari di atas garis 50 hari sebagai penghakiman garis panjang
- RSI membentuk bentuk V, menunjukkan peluang untuk melabur
- Minimum pada baris pertama K adalah lebih rendah daripada minimum pada baris kedua K
- RSI garis K semasa lebih tinggi daripada RSI dua garis K sebelumnya
- RSI atas memakai 30 sebagai isyarat V-bentuk selesai, melakukan lebih
- Hentikan Kerosakan di bawah 8% harga kemasukan
- RSI melintasi 70 untuk memulakan kedudukan, dan stop loss bergerak ke harga kemasukan
- RSI melintasi 90 bermula tzinfo 3⁄4 kedudukan
- RSI melepasi 10 / Stop loss trigger, semua kosong
Analisis kelebihan
- Menggunakan EMA untuk menentukan arah trend utama dan mengelakkan operasi berlawanan arah
- Bentuk RSI V menilai peluang rebound di kawasan oversold, menangkap trend pembalikan
- Kawalan risiko MLS
Analisis risiko
- Penurunan pasaran mungkin tidak dapat dihentikan, menyebabkan kerugian besar
- RSI V bentuk isyarat mungkin terdapat kesilapan yang menyebabkan kerugian yang tidak perlu
Arah pengoptimuman
- Optimumkan parameter RSI untuk mencari bentuk RSI V yang lebih dipercayai
- Kebolehpercayaan isyarat pembalikan bersama-sama dengan penunjuk lain
- Mengoptimumkan strategi hentian kerugian, sambil mengelakkan terlalu radikal
ringkaskan
Strategi ini menggabungkan penapis EMA rata-rata dan penilaian bentuk RSI V, membentuk satu set strategi operasi garis pendek yang lebih dipercayai. Ia dapat memanfaatkan peluang untuk bangkit di kawasan oversold dengan berkesan, dan menghasilkan keuntungan di garis pendek. Dengan terus mengoptimumkan parameter dan model, dan menyempurnakan mekanisme penangguhan, strategi ini dapat meningkatkan kestabilan dan keuntungan. Ia membuka pintu lain untuk keuntungan garis pendek bagi pedagang kuantitatif.
/*backtest
start: 2023-12-12 00:00:00
end: 2024-01-11 00:00:00
period: 1h
basePeriod: 15m
exchanges: [{"eid":"Futures_Binance","currency":"BTC_USDT"}]
*/

// This source code is subject to the terms of the Mozilla Public License 2.0 at https://mozilla.org/MPL/2.0/
// © mohanee

//@version=4
//strategy("RSI V Pattern", overlay=true)
strategy(title="RSI V Pattern", overlay=false )

//Strategy Rules
//ema20 is above ema50  --- candles are colored  green on the chart
//RSI value sharply coming up which makes a V shape ,  colored in yellow on the chart
//RSI V pattern should occur from below 30

len = input(title="RSI Period", minval=1, defval=5)
stopLoss = input(title="Stop Loss %", minval=1, defval=8)

myRsi = rsi(close,len)

longEmaVal=ema(close,50)
shortEmaVal=ema(close,20)

//plot emas
//plot(longEmaVal, title="Long EMA" ,linewidth=2, color=color.orange, trackprice=true)
//plot(shortEmaVal, title="Short EMA" ,linewidth=2, color=color.green, trackprice=true)


longCondition =  ema(close,20)>ema(close,50)   and (low[1]<low[2] and  low[1]<low[3]) and (myRsi>myRsi[1] and myRsi>myRsi[2] ) and crossover(myRsi,30) //  (   and myRsi<60)

//(myRsi<60 and myRsi>30)  and myRsi>myRsi[1] and (myRsi[1]<myRsi[2]  or  myRsi[1]<myRsi[3]) and (myRsi[2]<30)  and (myRsi[3]<30 and myRsi[4]>=30)


barcolor(shortEmaVal>longEmaVal?color.green:color.red)
//longCondition = crossover(sma(close, 14), sma(close, 28))
barcolor(longCondition?color.yellow:na)
strategy.entry("RSI_V_LE", strategy.long, when=longCondition )
//stoploss value at 10%
stopLossValue=strategy.position_avg_price -  (strategy.position_avg_price*stopLoss/100)
//stopLossValue=valuewhen(longCondition,low,3)


//takeprofit at RSI highest  reading
//at RSI75 move the stopLoss to entry price
moveStopLossUp=strategy.position_size>0 and crossunder(myRsi,70)
barcolor(moveStopLossUp?color.blue:na)
stopLossValue:=crossover(myRsi,70) ? strategy.position_avg_price:stopLossValue

//stopLossValue:=moveStopLossUp?strategy.position_avg_price:stopLossValue
rsiPlotColor=longCondition ?color.yellow:color.purple
rsiPlotColor:= moveStopLossUp ?color.blue:rsiPlotColor
plot(myRsi, title="RSI", linewidth=2, color=rsiPlotColor)
//longCondition?color.yellow:#8D1699)
hline(50, title="Middle Line", linestyle=hline.style_dotted)
obLevel = hline(75, title="Overbought", linestyle=hline.style_dotted)
osLevel = hline(25, title="Oversold", linestyle=hline.style_dotted)
fill(obLevel, osLevel, title="Background", color=#9915FF, transp=90)


//when RSI crossing down 70 , close 1/2 position and move stop loss to average entry price
strategy.close("RSI_V_LE",  qty=strategy.position_size*1/2, when=strategy.position_size>0 and crossunder(myRsi,70))

//when RSI reaches high reading 90 and crossing down close 3/4 position
strategy.close("RSI_V_LE",  qty=strategy.position_size*3/4, when=strategy.position_size>0 and crossunder(myRsi,90))


//close everything when Rsi goes down below to 10 or stoploss hit
//just keeping RSI cross below 10 , can work as stop loss , which also keeps you long in the trade ... however sharp declines could  make large loss
//so I combine RSI goes below 10 OR stoploss hit  , whichever comes first - whole posiition closed
longCloseCondition=crossunder(myRsi,10)  or close<stopLossValue
strategy.close("RSI_V_LE", qty=strategy.position_size,when=longCloseCondition )