Triple Moving Average dan Strategi Kuantitatif Gabungan MACD
Gambaran keseluruhan
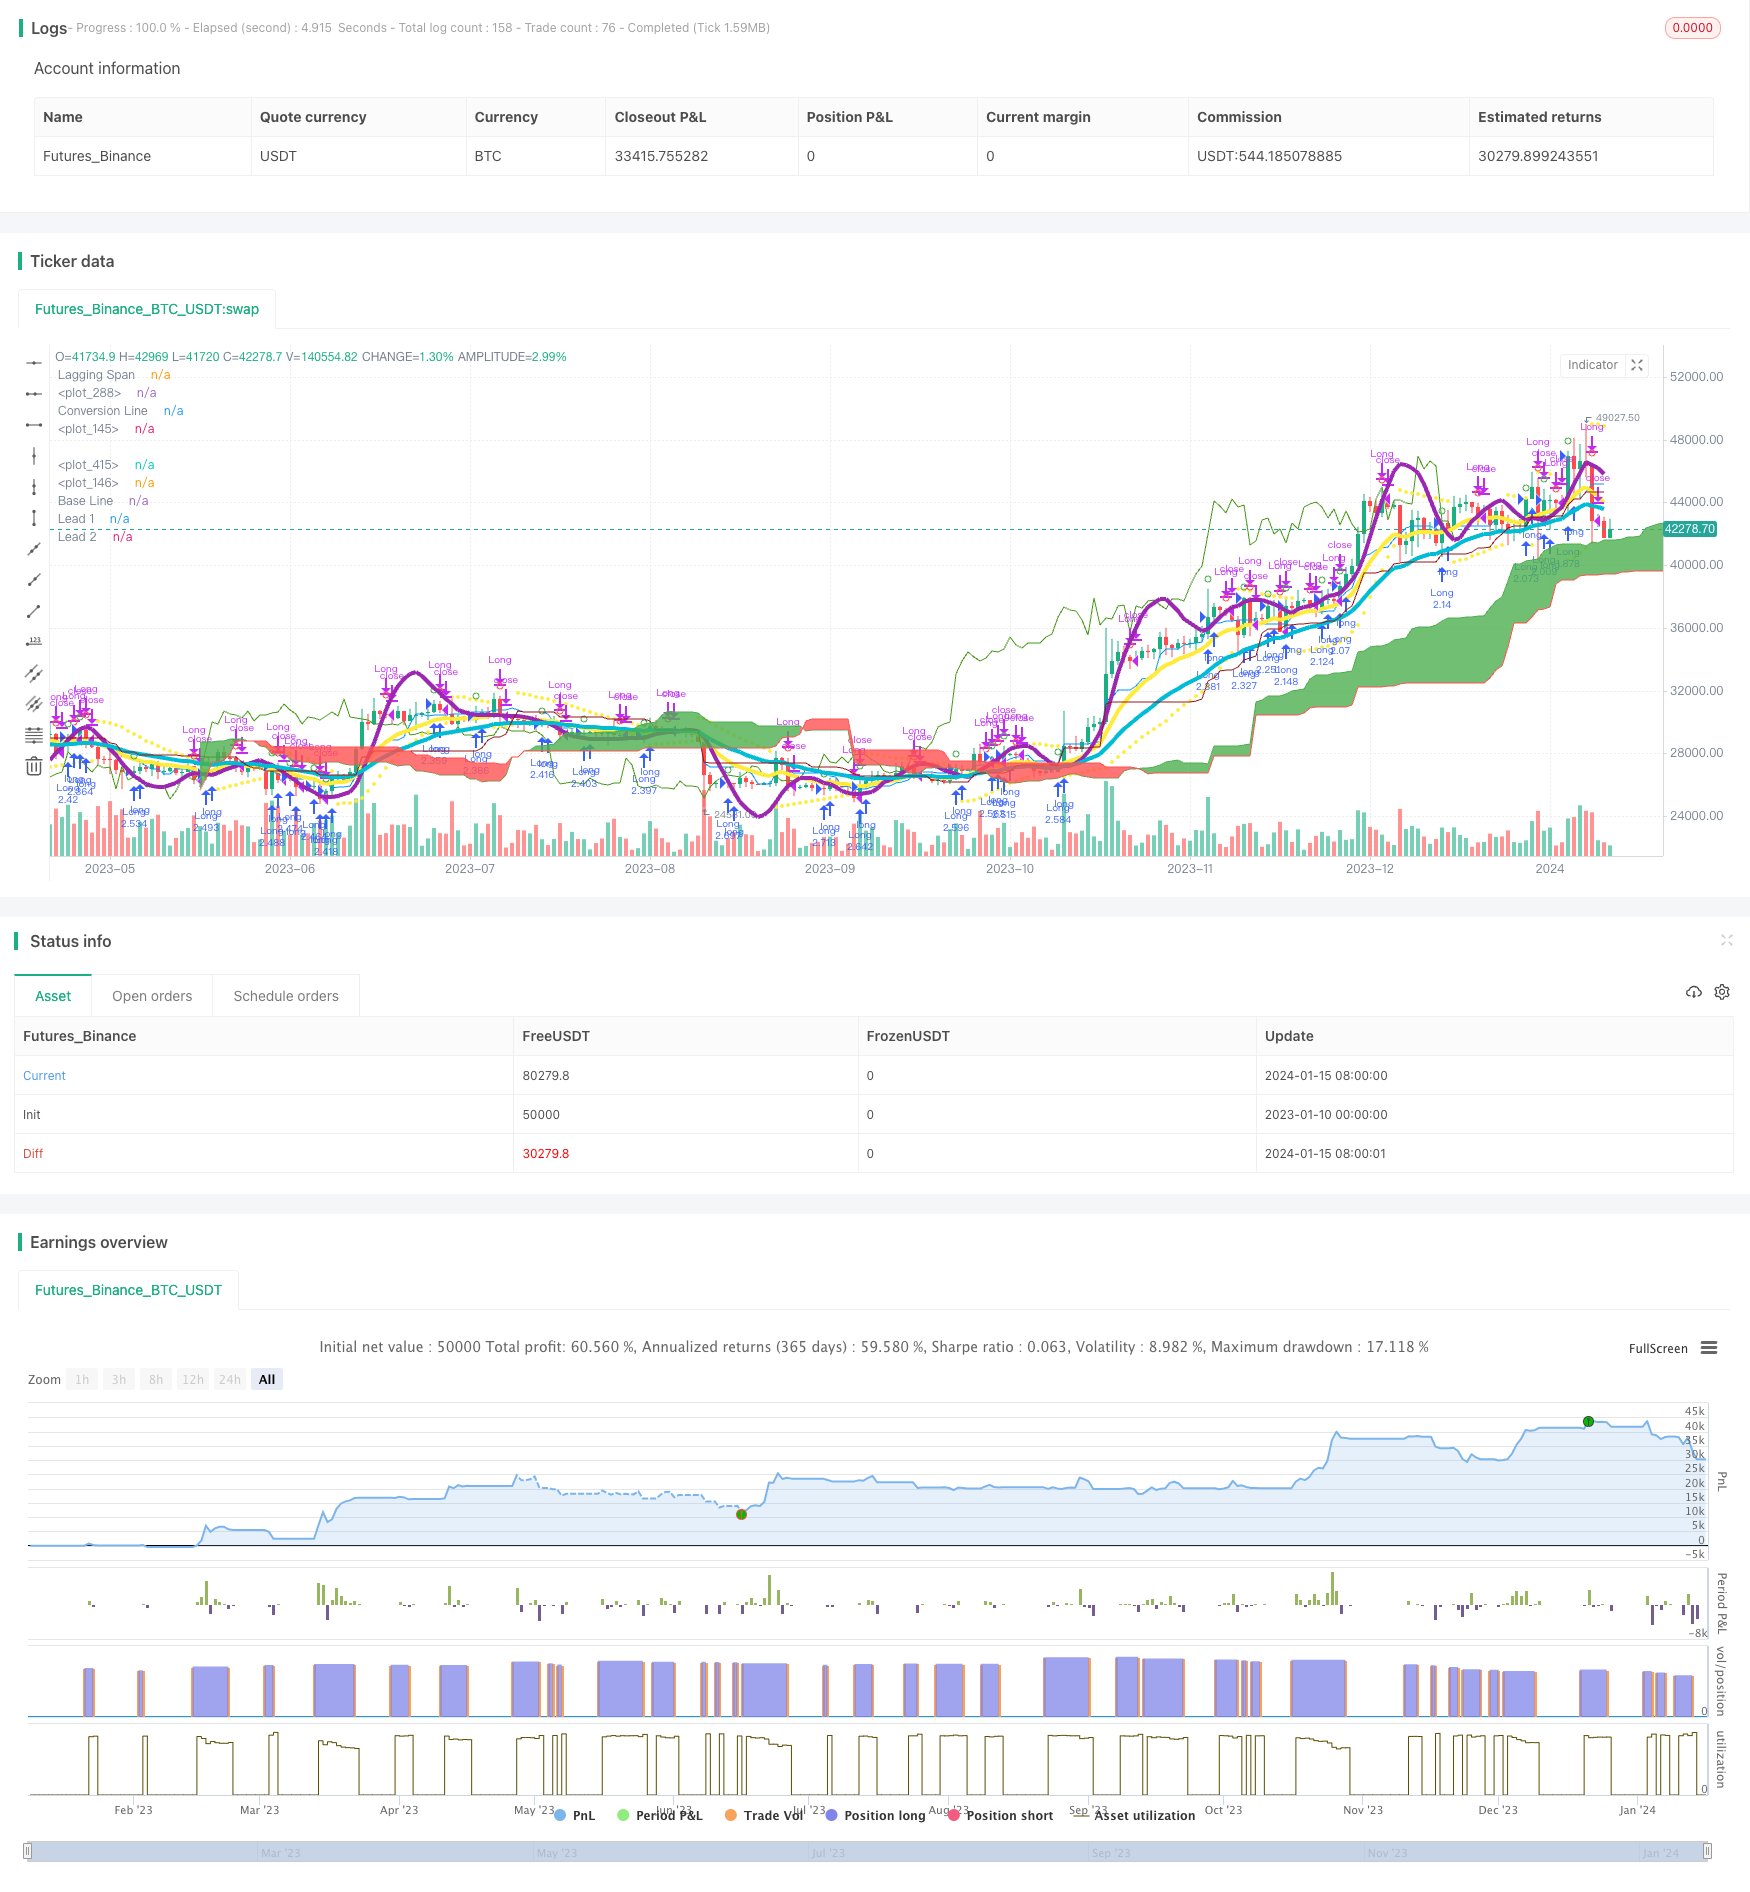
Strategi ini menggunakan gabungan Triple Moving Average Indicator dan MACD Indicator untuk membangunkan strategi perdagangan kuantitatif yang lebih stabil dan boleh dipercayai. Strategi ini bertujuan untuk menangkap trend yang mungkin berlaku pada masa depan, khususnya untuk memegang kedudukan jangka panjang.
Prinsip Strategi
Strategi ini adalah berdasarkan kepada penggunaan gabungan purata bergerak tiga kali ganda dan penunjuk MACD.
Pertama, strategi ini menggunakan purata bergerak tiga ponential dengan panjang 3, 7 dan 2. Tiga purata bergerak ini membina sistem purata bergerak yang cepat dan perlahan untuk menentukan arah trend masa depan. Apabila rata-rata bergerak jangka pendek melintasi rata-rata bergerak jangka panjang, ia memberi isyarat lebih banyak; apabila rata-rata bergerak jangka pendek melintasi rata-rata bergerak jangka panjang, ia memberi isyarat kosong.
Kedua, strategi ini juga menggunakan penunjuk MACD dengan parameter 3 dan 7 pada masa yang sama. Apabila MACD melintasi garis isyarat di atas saluran utama, ia bertindak sebagai isyarat yang lebih banyak, dan ketika ia melintasi saluran bawah, ia bertindak sebagai isyarat kosong.
Dengan menggunakan gabungan dua indikator, anda dapat mengelakkan banyak isyarat salah yang disebabkan oleh satu indikator, yang meningkatkan kestabilan strategi.
Kelebihan Strategik
- Menggunakan penapis dua arah untuk meningkatkan kualiti isyarat
- Parameter telah dioptimumkan melalui pelbagai ujian, stabil dan boleh dipercayai
- Menggunakan sistem purata bergerak tiga kali ganda untuk menyaring bunyi pasaran dan menilai trend masa depan
- Penetapan parameter indikator MACD lebih cepat untuk menangkap peluang jangka pendek dengan cepat
Risiko Strategik
- Terdapat beberapa risiko penarikan balik dan kerugian berterusan
- Strategi ini menyebabkan lebih banyak perdagangan yang salah apabila pasaran tidak mempunyai trend yang jelas.
- Penunjuk MACD mudah menghasilkan isyarat yang salah dan perlu digunakan dalam kombinasi dengan penunjuk garis rata
Penyelesaian:
- Menggunakan strategi henti rugi yang sesuai untuk mengawal pengeluaran maksimum
- Mengurangkan frekuensi dagangan apabila keadaan pasaran tidak menunjukkan trend
- Mengoptimumkan parameter MACD dan digunakan dengan kombinasi penunjuk lain
Arah pengoptimuman strategi
- Uji dan mengoptimumkan parameter purata bergerak dan MACD untuk mencari kombinasi terbaik
- Tambah petunjuk tambahan seperti KDJ, VRSI dan lain-lain untuk mengelakkan isyarat salah
- Menggunakan model pembelajaran mesin untuk menilai keadaan pasaran dan menyesuaikan diri secara dinamik
- Menetapkan titik hentian yang optimum dengan strategi hentian
ringkaskan
Strategi ini mewujudkan tangkapan trend yang stabil melalui gabungan purata bergerak dan MACD. Kelebihannya adalah bahawa penggunaan gabungan penunjuk dapat mengurangkan isyarat yang salah, yang akan memberikan kesan strategi yang lebih baik. Langkah seterusnya, dengan mengoptimumkan parameter, memperkenalkan strategi stop loss, dan penyesuaian dinamik, strategi ini akan disempurnakan lagi, menjadikannya alat yang berkesan untuk mencari peluang garis tengah.
/*backtest
start: 2023-01-10 00:00:00
end: 2024-01-16 00:00:00
period: 1d
basePeriod: 1h
exchanges: [{"eid":"Futures_Binance","currency":"BTC_USDT"}]
*/

//@version=3
strategy("Matt's MACD Algo v1", shorttitle="Matt's MACD Algo v1", overlay=true, pyramiding = 0, default_qty_type = strategy.percent_of_equity, default_qty_value = 100, initial_capital=7000, calc_on_order_fills = true, commission_type=strategy.commission.percent, commission_value=0, currency = currency.USD)
//study("MFI Fresh", shorttitle="MFI Fresh", overlay=true)

//Risk Management Settings
//trategy.risk.max_drawdown(20, strategy.percent_of_equity)
//strategy.risk.max_intraday_loss(10, strategy.percent_of_equity)
//strategy.risk.max_cons_loss_days(3)

/////////////////
ts = input(title="Trailing Stop in cents", defval=50)/100

//Time Inputs
FromMonth = input(defval = 6, title = "From Month", minval = 1)
FromDay   = input(defval = 1, title = "From Day", minval = 1)
FromYear  = input(defval = 2017, title = "From Year", minval = 1)
ToMonth   = input(defval = 1, title = "To Month", minval = 1)
ToDay     = input(defval = 1, title = "To Day", minval = 1)
ToYear    = input(defval = 9999, title = "To Year", minval = 1)

//Time Variable
testPeriod() =>
    (time > timestamp(FromYear, FromMonth, FromDay, 09, 30)) and (time < timestamp(ToYear, ToMonth, ToDay, 09, 29))

//MA On and MA Colors On? Inputs
switch1=input(false, title="Enable Bar Color?")
switch2=input(true, title="Enable Moving Averages?")
switch3=input(false, title="Enable Background Color?")
switch4=input(false, title="Enable Bolinger Bands?")
switch5=input(false, title="Enable Keltner Channel?")

////////////////////////////////Williams %R
R_length = input(14, minval=1)
R_overBought = input(title="%R Overbought", defval=80)
R_overSold = input(title="%R Oversold", defval=20)
R_upper = highest(R_length)
R_lower = lowest(R_length)
R_out = 100 * (close - R_upper) / (R_upper - R_lower)

WilliamsR_longEntry = crossover(R_out, R_overSold)
WilliamsR_shortEntry = crossunder(R_out, R_overBought)

//plot(R_out)
//R_band1 = hline(R_overSold)
//R_band0 = hline(R_overBought)
//fill(R_band1, R_band0)

////////////////////////////////RSI Variables
rsi_source = close
RSI_Length = input(title="RSI Length", defval=3)
RSI_overBought = input(title="RSI Overbought", defval=80)
RSI_overSold = input(title="RSI Oversold", defval=20)

up = rma(max(change(rsi_source), 0), RSI_Length)
down = rma(-min(change(rsi_source), 0), RSI_Length)
rsi = down == 0 ? 100 : up == 0 ? 0 : 100 - (100 / (1 + up / down))

RSI_longEntry = rsi > 50
//crossover(rsi, RSI_overSold)
RSI_shortEntry = rsi < 50
//crossunder(rsi, RSI_overBought)

//plot(rsi, color=purple)
//band1 = hline(RSI_overBought)
//band0 = hline(RSI_overSold)
//fill(band1, band0, color=purple, transp=90)


//////////////////////Commodity Channel Index
cci_length = input(20, minval=1)
cci_src = input(close, title="Source")
cci_ma = sma(cci_src, cci_length)
cci = (cci_src - cci_ma) / (0.015 * dev(cci_src, cci_length))


cci_longEntry = crossover(cci, -100)
cci_shortEntry = crossunder(cci, 100)

//plot(cci, color=olive)
//cci_band1 = hline(100, color=gray, linestyle=dashed)
//cci_band0 = hline(-100, color=gray, linestyle=dashed)
//fill(cci_band1, cci_band0, color=olive)


//MFI Inputs
MFI_length = input(title="MFI Length", defval=3)
MFI_overBought = input(title="MFI Overbought", defval=80)
MFI_overSold = input(title="MFI Oversold", defval=20)

//MFI Variables
rawMoneyFlow = hlc3 * volume
positiveMoneyFlow = 0.0
positiveMoneyFlow := hlc3 > hlc3[1] ? positiveMoneyFlow + rawMoneyFlow : positiveMoneyFlow
negativeMoneyFlow = 0.0
negativeMoneyFlow :=  hlc3 < hlc3[1] ? negativeMoneyFlow + rawMoneyFlow : negativeMoneyFlow
moneyFlowRatio = sma(positiveMoneyFlow, MFI_length) / sma(negativeMoneyFlow, MFI_length)
moneyFlowIndex = 100 - 100 / (1 + moneyFlowRatio)

MFI_longEntry = (crossover(moneyFlowIndex, MFI_overSold))
MFI_shortEntry = (crossunder(moneyFlowIndex, MFI_overBought))


///// MFI Plot for STUDY
//plot(moneyFlowIndex, color=#459915)
//MFI_OB=hline(MFI_overBought, title="Overbought", color=#c0c0c0)
//MFI_OS=hline(MFI_overSold, title="Oversold", color=#c0c0c0)
//fill(MFI_overBought, MFI_overSold, color=#9915ff, transp=90)


////VERY SLOW SMA
veryslowLength=input(50,minval=1, title="Very slow SMA")
veryslowSMA = sma(close, veryslowLength)


//MACD Inputs
source = input(close, title="MACD source")
fastLength = input(title="MACD Fast Length", defval=12)
fastLength2 = input(title="MACD Fast Length #2", defval=3)
slowLength = input(title="MACD Slow Length", defval=26)
slowLength2 = input(title="MACD Slow Length #2", defval=7)
MACD_fastsignalSmoothing = input(title="Signal Smoothing", defval=7)
MACD_slowsignalSmoothing = input(title="Signal Smoothing", defval=12)
MACD_fastsignalSmoothing2 = input(title="Signal Smoothing #2", defval=5)
MACD_slowsignalSmoothing2 = input(title="Signal Smoothing #2", defval=9)
MACD_percentthreshold = input(title="MACD % Threshold", defval=-0.0030, step=0.0001)

//MACD variables
fastEMA = ema(source, fastLength)
fastEMA2 = ema(source, fastLength2)
slowEMA = ema(source, slowLength)
slowEMA2 = ema(source, slowLength2)
MACD_Line = fastEMA - slowEMA
MACD_Line2 = fastEMA2 - slowEMA2
MACD_fastsignalLine = ema(MACD_Line, MACD_fastsignalSmoothing)
MACD_slowsignalLine = ema(MACD_Line, MACD_slowsignalSmoothing)
MACD_fastsignalLine2 = ema(MACD_Line2, MACD_fastsignalSmoothing2)
MACD_slowsignalLine2 = ema(MACD_Line2, MACD_slowsignalSmoothing2)
fasthist = MACD_Line - MACD_slowsignalLine
MACD_Histogram2 = MACD_Line2 - MACD_fastsignalLine2
minimum = close * MACD_percentthreshold
SMA = sma(MACD_Line, 10)

// MACD and veryslowSMA Plot for STRATEGY
Fast=plot(switch2?fastEMA:na,color=yellow, linewidth=4)
Slow=plot(switch2?slowEMA:na,color=aqua, linewidth=4)
//VerySlow=plot(switch2?veryslowSMA:na,color=purple,linewidth=4)
//fill(Fast,VerySlow,color=gray)

/////// MACD Plots for STUDY
//plot(fasthist, color=fasthist>0 and fasthist[0]>fasthist[1]?#00ff00:fasthist<=0 and fasthist[0]<fasthist[1]?#f72e2e:fasthist>0 and fasthist[0]<fasthist[1]?#008000:fasthist<0 and fasthist[0]>fasthist[1]?#7f0000:white, style=histogram)
//plot(slowhist, color=slowhist>0 and slowhist[0]>slowhist[1]?#00ff00:slowhist<=0 and slowhist[0]<slowhist[1]?#f72e2e:slowhist>0 and slowhist[0]<slowhist[1]?#008000:slowhist<0 and slowhist[0]>slowhist[1]?#7f0000:white, style=histogram)
//plot(MACD_Line, color=yellow, title="MACD Line")
//plot(MACD_fastsignalSmoothing, color=green, title="Fast Signal Line")
//plot(MACD_slowsignalSmoothing, color=red, title="Slow Signal Line")
//plot(MACD_Line2, color=aqua, title="MACD Line 2")
//plot(MACD_fastsignalSmoothing2, color=orange, title="Fast Signal Line 2")
//plot(MACD_slowsignalSmoothing2, color=white, title="Slow Signal Line 2")
//plot(minimum, color=white, title="% Threshold")
//plot(fasthist, color=fasthist>0 and fasthist[0]>fasthist[1]?#00ff00:fasthist<=0 and fasthist[0]<fasthist[1]?#f72e2e:fasthist>0 and fasthist[0]<fasthist[1]?#008000:fasthist<0 and fasthist[0]>fasthist[1]?#7f0000:white, style=histogram)
//plot(MACD_Histogram2, color=MACD_Histogram2>0?blue:MACD_Histogram2<0?orange:white, style=histogram)
//plot(SMA, color=white, title="SMA")

//MACD Entry Conditions
MACD_longEntry2 = (crossover(MACD_Histogram2, 0))
MACD_shortEntry2 = (crossunder(MACD_Histogram2, 0))
MACD_longEntry = (crossover(fasthist, 0))
MACD_shortEntry = (crossunder(fasthist, 0))


// Colors
//MAtrendcolor = change(veryslowSMA) > 0 ? green : red
//trendcolor = fastEMA > slowEMA and change(veryslowSMA) > 0 and close > slowEMA ? green : fastEMA < slowEMA and change(veryslowSMA) < 0 and close < slowEMA ? red : yellow
//bartrendcolor = close > fastEMA and close > slowEMA and close > veryslowSMA and change(slowEMA) > 0 ? green : close < fastEMA and close < slowEMA and close < veryslowSMA and change(slowEMA) < 0 ? red : yellow
//backgroundcolor = slowEMA > veryslowSMA and MACD_longEntry and MACD_Line > 0 and fastEMA > slowEMA and close[slowLength] > veryslowSMA ? green : slowEMA < veryslowSMA and MACD_shortEntry and MACD_Line < 0 and fastEMA < slowEMA and close[slowLength] < veryslowSMA ? red : na
//barcolor(switch1?bartrendcolor:na)

// Conditional Bar Colors
//backgroundcolor = (MACD_longEntry ? green : MACD_shortEntry ? red : na)
//bgcolor(switch3?backgroundcolor:na,transp=80)


////BOLLINGER BAND Conditions
bb_source = close
bb_length = input(20, minval=1)
bb_mult = input(1.86, minval=0.001, maxval=50)

bb_basis = ema(bb_source, bb_length)
bb_dev = bb_mult * stdev(bb_source, bb_length)

bb_upper = bb_basis + bb_dev
bb_lower = bb_basis - bb_dev

bb_longEntry = crossover(bb_source, bb_lower)
bb_shortEntry = crossunder(bb_source, bb_upper)

plot(switch4?bb_basis:na, color=red, linewidth=4)
p1=plot(switch4?bb_upper:na)
p2=plot(switch4?bb_lower:na)
fill(p1,p2, color=aqua, transp=95)

////KELTNER CHANNEL Inputs/Variables/Plots
KC_useTrueRange = input(true)
KC_length = input(20, minval=1)
KC_mult = input(3.0)
KC_source = input(close, title="Source")

KC_ma = ema(KC_source, KC_length)
KC_range = KC_useTrueRange ? tr : high - low
KC_rangema = ema(KC_range, KC_length)
KC_upper = KC_ma + KC_rangema * KC_mult
KC_lower = KC_ma - KC_rangema * KC_mult

KC_longEntry = crossover(KC_source, KC_lower)
KC_shortEntry = crossunder(KC_source, KC_upper)

plot(switch5?KC_ma:na, color=red, title="Basis")
KC_u = plot(switch5?KC_upper:na, color=red, title="Upper")
KC_l = plot(switch5?KC_lower:na, color=red, title="Lower")
fill(KC_u, KC_l, color=red)

///////////////////ADX
//len = input(title="ADX Length", type=integer, defval=14)
//th = input(title="ADX threshold", type=integer, defval=20)

//TrueRange = max(max(high-low, abs(high-nz(close[1]))), abs(low-nz(close[1])))
//DirectionalMovementPlus = high-nz(high[1]) > nz(low[1])-low ? max(high-nz(high[1]), 0): 0
//DirectionalMovementMinus = nz(low[1])-low > high-nz(high[1]) ? max(nz(low[1])-low, 0): 0


//SmoothedTrueRange = nz(SmoothedTrueRange[1]) - (nz(SmoothedTrueRange[1])/len) + TrueRange
//SmoothedDirectionalMovementPlus = nz(SmoothedDirectionalMovementPlus[1]) - (nz(SmoothedDirectionalMovementPlus[1])/len) + DirectionalMovementPlus
//SmoothedDirectionalMovementMinus = nz(SmoothedDirectionalMovementMinus[1]) - (nz(SmoothedDirectionalMovementMinus[1])/len) + DirectionalMovementMinus

//DIPlus = sma(SmoothedDirectionalMovementPlus / SmoothedTrueRange * 100, len)
//DIMinus = sma(SmoothedDirectionalMovementMinus / SmoothedTrueRange * 100, len)
//DX = abs(DIPlus-DIMinus) / (DIPlus+DIMinus)*100
//ADX = sma(DX, len)


///
//ADX_longEntry = crossover(DIPlus, DIMinus) //or (DIPlus > DIMinus and DIPlus > th and ADX > th)
//ADX_shortEntry = crossover(DIMinus, DIPlus) //or (DIMinus > DIPlus and DIMinus > th and ADX > th)


//DI_long = if DIPlus > DIMinus and ADX > 20 and DIPlus > 20


//plot(DIPlus, color=green, title="DI+")
//plot(DIMinus, color=red, title="DI-")
//plot(ADX, color=black, title="ADX")
//hline(th, color=black, linestyle=dashed)


//////////////////////////////////Playing with RES


r1 = input("5", "Resolution")
r2 = input("15", "Resolution")
r3 = input("30", "Resolution")
r4 = input("60", "Resolution")

o1 = request.security(heikinashi(syminfo.tickerid), r1, MACD_Line[1])
c1 = request.security(heikinashi(syminfo.tickerid), r1, MACD_slowsignalLine[1])
o2 = request.security(heikinashi(syminfo.tickerid), r2, MACD_Line[1])
c2 = request.security(heikinashi(syminfo.tickerid), r2, MACD_slowsignalLine[1])
o3 = request.security(heikinashi(syminfo.tickerid), r3, MACD_Line[1])
c3 = request.security(heikinashi(syminfo.tickerid), r3, MACD_slowsignalLine[1])
o4 = request.security(heikinashi(syminfo.tickerid), r4, MACD_Line[1])
c4 = request.security(heikinashi(syminfo.tickerid), r4, MACD_slowsignalLine[1])

res_long = (o4 > c4 and o3 > c3 and o2 > c2 and o1 > c1)
res_short = (o4 < c4 and o3 < c3 and o2 < c2 and o1 < c1)

///////////////////// Parabolic SAR (stop and reverse)
start = input(0.02)
increment = input(0.02)
maximum = input(0.2)

psar = sar(start, increment, maximum)
plot(psar, style=circles, color=yellow)

psar_longEntry = close > psar
psar_longExit = crossunder(close, psar)
psar_shortEntry = close < psar//crossunder(close, psar)
psar_shortExit = crossover(close, psar)

mix = (moneyFlowIndex + rsi)/2
RSI_MFI = ema(mix, input(3))
//color = RSI_MFI > 80 ? red :RSI_MFI < 20  ? green : silver
vrsi = RSI_MFI

rsiBuySell = vrsi[1] < 95 and crossover(vrsi, 95) or vrsi[1] < 90 and crossover(vrsi, 90) or vrsi[1] < 85 and crossover(vrsi, 85) or vrsi[1] < 80 and crossover(vrsi, 80)  or vrsi[1] < 75 and crossover(vrsi, 75) or vrsi[1] < 70 and  crossover(vrsi, 70)  or vrsi[1] < 65 and crossover(vrsi, 65) or vrsi[1] < 60 and  crossover(vrsi, 60)  or vrsi[1] < 55 and crossover(vrsi, 55) or vrsi[1] < 50 and crossover(vrsi, 50) or vrsi[1] < 45 and crossover(vrsi, 45) or vrsi[1] < 40 and  crossover(vrsi, 40) or vrsi[1] < 35 and crossover(vrsi, 35) or vrsi[1] < 30 and crossover(vrsi, 30) or vrsi[1] < 25 and crossover(vrsi, 25) or vrsi[1] < 20 and  crossover(vrsi, 20) or vrsi[1] < 15 and crossover(vrsi, 15) or  vrsi[1] < 10 and crossover(vrsi, 10) or  vrsi[1] < 5 and crossover(vrsi, 5)  ? 1 :  vrsi[1] > 95 and  crossunder(vrsi, 95) or vrsi[1] > 90 and  crossunder(vrsi, 90) or  vrsi[1] > 85 and  crossunder(vrsi, 85) or vrsi[1] > 80 and crossunder(vrsi, 80) or  vrsi[1] > 75 and  crossunder(vrsi, 75) or vrsi[1] > 70 and  crossunder(vrsi, 70) or  vrsi[1] > 65 and  crossunder(vrsi, 65) or vrsi[1] > 60 and crossunder(vrsi, 60) or  vrsi[1] > 55 and  crossunder(vrsi, 55) or vrsi[1] > 50 and crossunder(vrsi, 50) or  vrsi[1] > 45 and  crossunder(vrsi, 45) or vrsi[1] > 40 and crossunder(vrsi, 40) or  vrsi[1] > 35 and  crossunder(vrsi, 35) or vrsi[1] > 30 and crossunder(vrsi, 30) or  vrsi[1] > 25 and  crossunder(vrsi, 25) or vrsi[1] > 20 and  crossunder(vrsi, 20) or vrsi[1] > 15 and crossunder(vrsi, 15) or vrsi[1] > 10 and crossunder(vrsi, 10) or  vrsi[1] > 5 and  crossunder(vrsi, 5) ?-1:na

//////////////////////////////////Entry Conditions
//
MA1 = ema(hlc3, input(3))
MA2 = wma(MA1, input(7))
MA3 = ema(MA2, input(2))
MA4 = wma(MA3, input(1))

buy =  close > MA4 or hlc3[1] < MA4 and hlc3 > MA4 and rsiBuySell == 1
sell = close < MA4 or hlc3[1] > MA4 and hlc3 < MA4 and rsiBuySell == -1

p=14

CO=close-open
HL=high-low

value1 = (CO + 2*CO[1] + 2*CO[2] + CO[3])/6
value2 = (HL + 2*HL[1] + 2*HL[2] + HL[3])/6

num=sum(value1,p)
denom=sum(value2,p)

RVI=denom!=0?num/denom:0

RVIsig=(RVI+ 2*RVI[1] + 2*RVI[2] + RVI[3])/6

//plot(RVI,color=white,style=line,linewidth=1)
//plot(RVIsig,color=orange,style=line,linewidth=1)

Tenkan_periods = input(9, minval=1, title="Conversion Line Periods"),
Kijun_periods = input(26, minval=1, title="Base Line Periods")
Senkou_Span_B_Length = input(50, minval=1, title="Lagging Span 2 Periods"),
Chikou_Span_Length = input(25, minval=1, title="Displacement")

donchian(len) => avg(lowest(len), highest(len))

Tenkan_sen = donchian(Tenkan_periods)
Kijun_sen = donchian(Kijun_periods)
Senkou_Span_A = avg(Tenkan_sen, Kijun_sen)
Senkou_Span_B = donchian(Senkou_Span_B_Length)

plot(Tenkan_sen, color=#0496ff, title="Conversion Line")
plot(Kijun_sen, color=#991515, title="Base Line")
plot(close, offset = -Chikou_Span_Length, color=#459915, title="Lagging Span")

p3 = plot(Senkou_Span_A, offset = Chikou_Span_Length, color=green,
 title="Lead 1")
p4 = plot(Senkou_Span_B, offset = Chikou_Span_Length, color=red,
 title="Lead 2")
fill(p3, p4, color = Senkou_Span_A > Senkou_Span_B ? green : red, transp=50)

Ichimoku_longEntry = Senkou_Span_B < Senkou_Span_A
Ichimoku_shortEntry = Senkou_Span_A < Senkou_Span_B

len9 = input(9, minval=1, title="Length")
srce = input(hlc3, title="Source")
ema9 = ema(srce, len9)
sma50 = sma(ema9, 80)
sma30 = vwma(sma50, 26)
ema930 = ema(sma30, 9)
//plot(ema930, color=blue, title="MA", linewidth=5, transp=0)

SMA100 = sma(input(ohlc4), input(10))
Lookback = SMA100[input(7)]
sma300 = SMA100 + (SMA100 - Lookback)


//if Ichimoku_longEntry
longEntry = (MACD_longEntry2) //or Stoch_longEntry// or buy //or cci_longEntry  or bb_longEntry or psar_shortExit //or  //// // KC_longEntry// or WilliamsR_longEntry//  // // or RSI_longEntry// // or  or MFI_longEntry// or crossover(close,psar) //(o4 < c4 and o3 < c3 and o2 < c2 and o1 < c1)

//if Ichimoku_shortEntry
shortEntry = (MACD_shortEntry2) //or Stoch_shortEntry// or sell//or cci_shortEntry or bb_shortEntry or psar_longExit//   // //or KC_shortEntry// or WilliamsR_shortEntry//  //or cci_shortEntry //  // or  or MFI_shortEntry// or crossunder(close,psar)// (o4 < c4 and o3 < c3 and o2 < c2 and o1 < c1)


//longExit = shortEntry or psar_longExit // if not (ADX > th and )
//shortExit = longEntry or psar_shortExit // if not (ADX > th and )

////psar for trailing stops or some other measure? we must have a good trailing stop.

///////////////////////////////Strategy Execution

if testPeriod()
    strategy.entry("Long", strategy.long, when=longEntry)
    strategy.close("Long", when=shortEntry)

//if testPeriod()
//    strategy.entry("Long", strategy.long, when=longEntry)
//    strategy.exit("Exit Long", "Long", when=shortEntry)
//else
//    strategy.cancel("Long")
//if testPeriod()
//    strategy.entry("Short", strategy.short, when=shortEntry)
//    strategy.exit("Exit Short", "Short", when=longEntry)
//else
//    strategy.cancel("Long")

//Other Plots and Alerts
plotshape(MACD_longEntry2,  title= "3,7 Long Open", color=green, style=shape.circle)
plotshape(MACD_shortEntry2,  title= "3,7 Short Open", color=red, style=shape.circle)
//plotshape(Stoch_longEntry,  title= "Stoch Long Open", color=aqua, style=shape.circle)
//plotshape(Stoch_shortEntry,  title= "Stoch Short Open", color=orange, style=shape.circle)
//plotshape(buy,  title= "RES Long Open", color=green, location=location.belowbar, style=shape.circle)
///plotshape(sell,  title= "RES Short Open", color=red, location=location.belowbar, style=shape.circle)
//plotshape(MACD_longEntry, title= "12,26 Long Open", color=green, style=shape.arrowup, size=size.normal, location=location.belowbar)
//plotshape(MACD_shortEntry, title= "12,26 Short Open", color=red, style=shape.arrowdown, size=size.normal, location=location.abovebar)
//plotshape(MACD_longEntry, title= "12,26 Long Open", color=green, style=shape.diamond, size=size.tiny, location=location.belowbar)
//plotshape(MACD_shortEntry, title= "12,26 Short Open", color=red, style=shape.diamond, size=size.tiny, location=location.abovebar)

//plotchar(longCondition, location=bottom char="L", color=green)
//plotchar(shortCondition, char="S", color=red)
//alertcondition(longCondition, title="MFI+MACD Long", message="(MFI crossOver 30) or MACD+")
//alertcondition(shortCondition, title="MFI+MACD Short", message="(MFI crossUnder 70) or MACD-")
plot(sma300, color=purple, linewidth=4)