Purata Pergerakan Selari dan Strategi Purata Pergerakan Tindak Balas Impuls Tak Terhingga
Gambaran keseluruhan
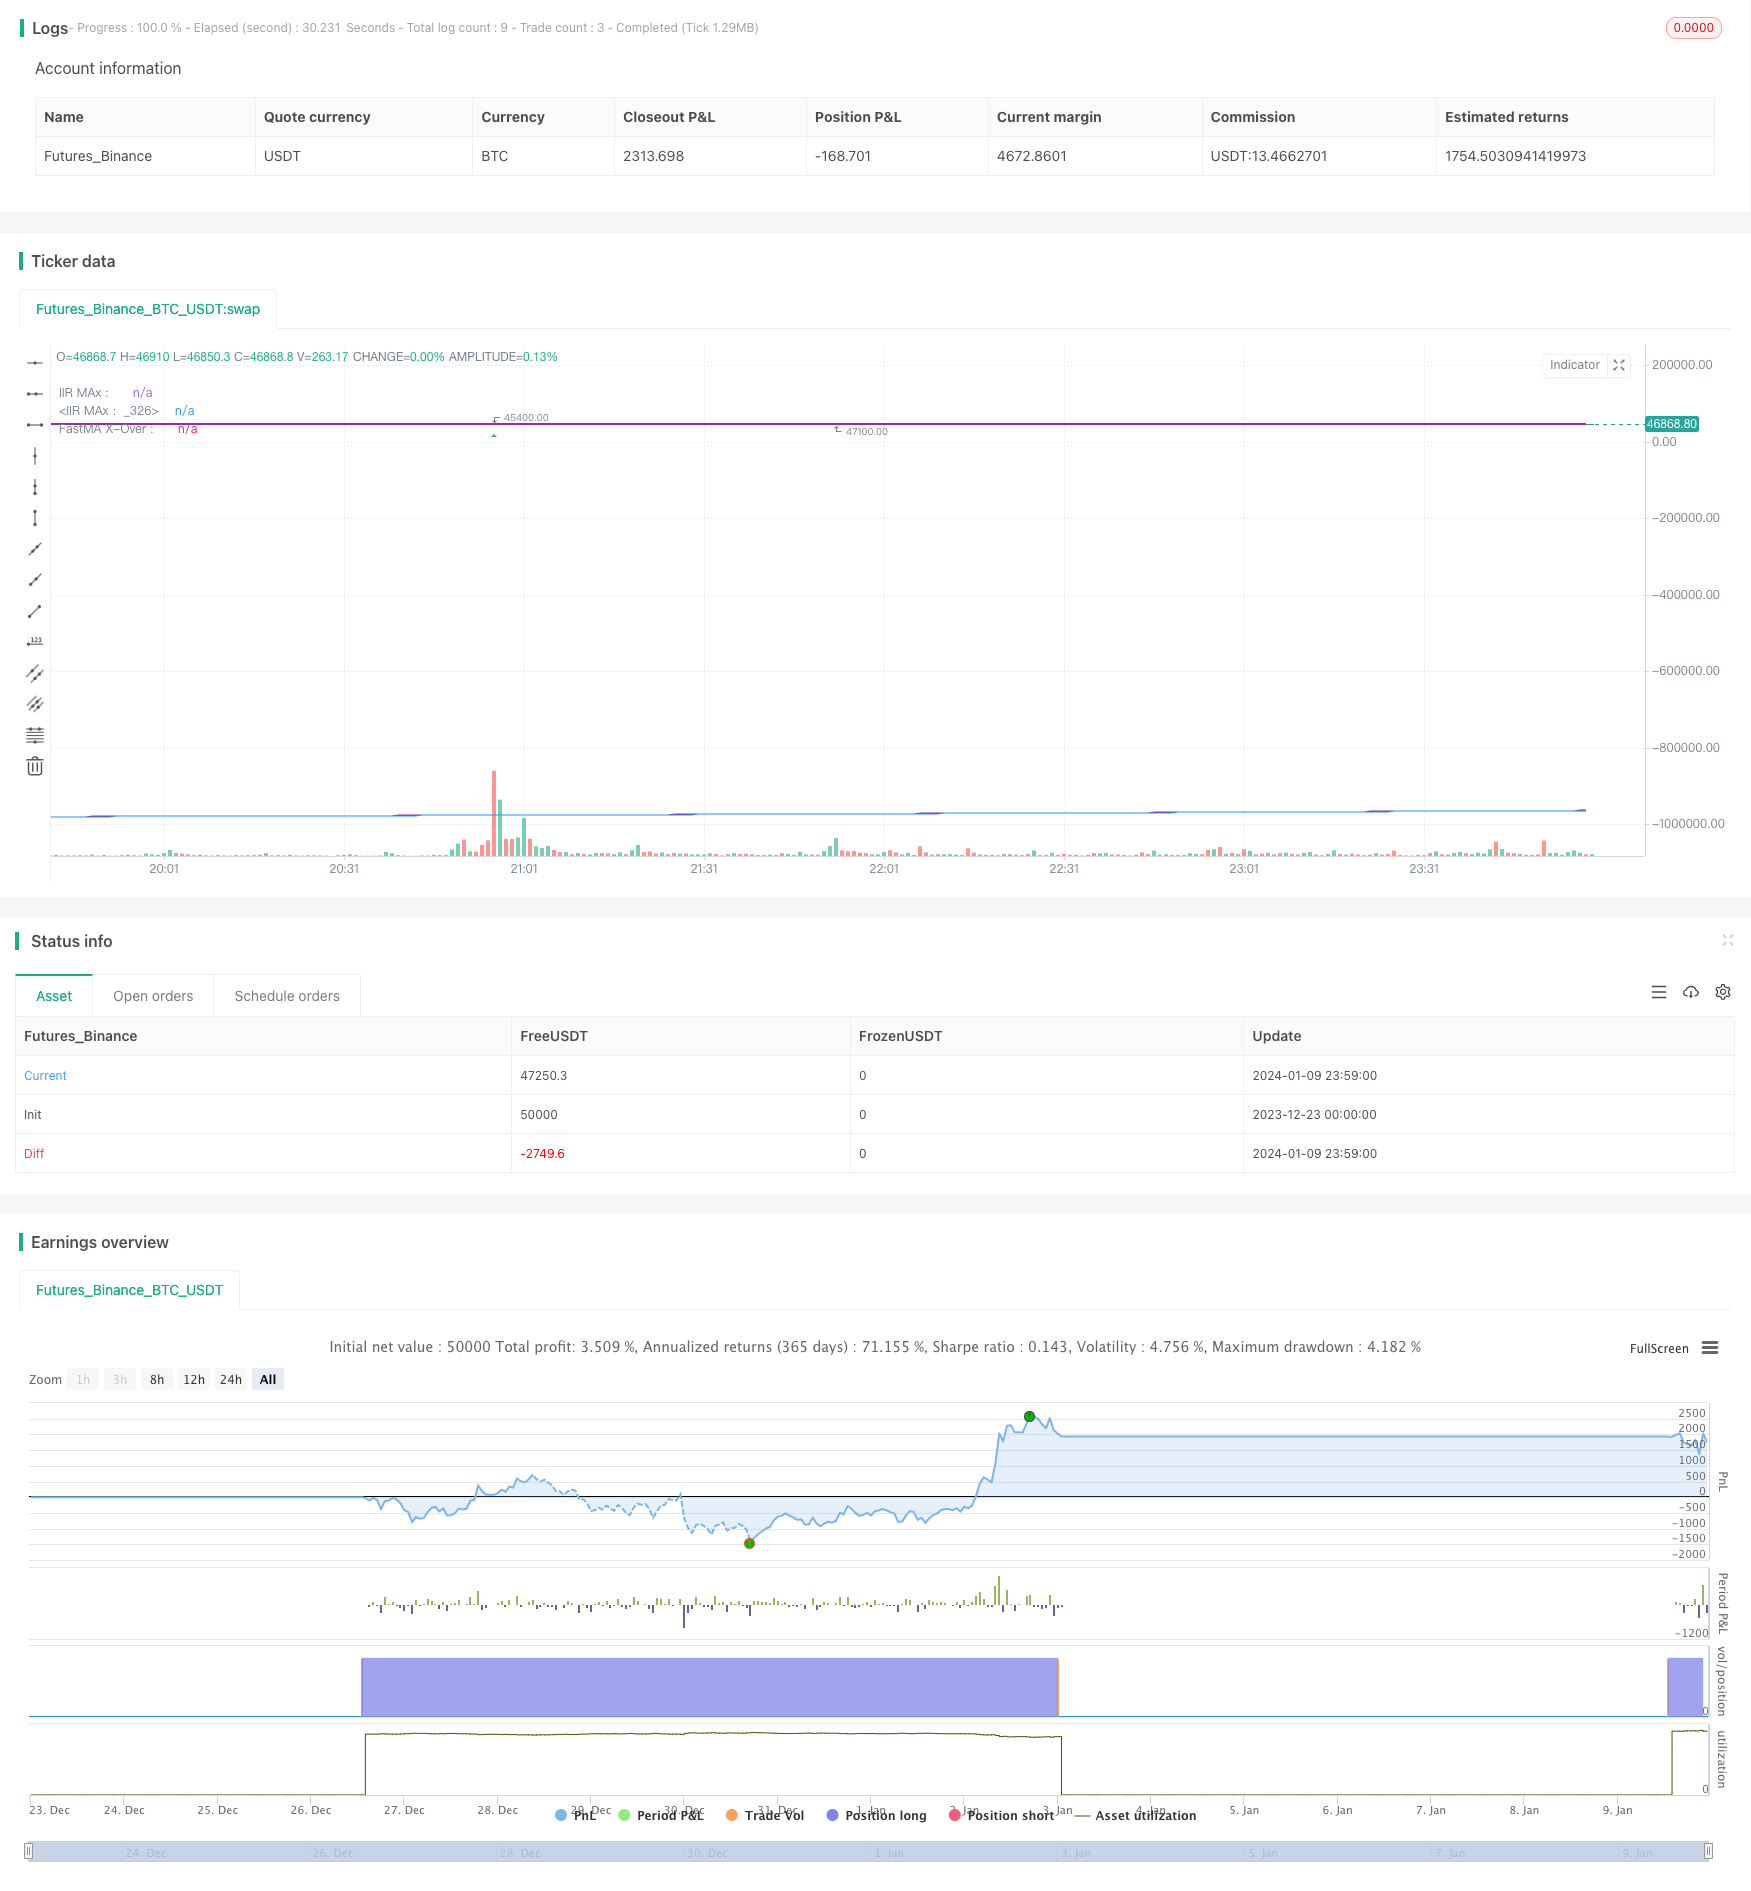
Ini adalah strategi kuantitatif yang menggabungkan penggunaan purata bergerak, purata tindak balas nadi tak terhingga (IIR) dan purata bergerak linear yang menyesuaikan diri (ALMA). Strategi ini mempunyai pelbagai kombinasi indikator yang dapat memberikan banyak isyarat perdagangan kepada peniaga.
Prinsip Strategi
Strategi ini terdiri daripada beberapa bahagian:
Ia menggunakan purata bergerak sederhana (SMA), ALMA dan IIR untuk mengesan isyarat silang antara mereka sebagai masa masuk perdagangan.
Menggunakan 3 IIR yang berbeza untuk menentukan sama ada harga berada dalam keadaan pekat dengan mengira jarak antara mereka. Keadaan pekat mewakili penurunan turun naik dan sering menandakan perubahan harga yang lebih besar akan datang.
Untuk menilai kemerosotan IIR, apabila kemerosotan meningkat, ia berwarna hijau, apabila ia menurun, ia berwarna biru. Anda boleh menilai pergerakan IIR secara intuitif.
Hitung sama ada jarak antara SMA sedang meluas, dan jika ya, buat tanda khas yang mewakili pembesaran selang kipas, yang biasanya bermaksud harga memasuki keadaan trend.
Isyarat overbought dan oversold yang digabungkan dengan indikator RSI yang agak lemah, melengkapi isyarat perdagangan.
Dengan menggunakan beberapa bahagian di atas dalam kombinasi, strategi ini dapat memberikan isyarat masuk, keputusan dan keluar perdagangan yang lebih komprehensif dan kaya.
Analisis kelebihan strategi
Kelebihan terbesar strategi ini adalah bahawa portofolio penunjuk adalah komprehensif dan kaya, mempertimbangkan penilaian trend, tetapi juga kadar turun naik dan keadaan overbought dan oversold, memberikan rujukan pelbagai dimensi untuk keputusan perdagangan.
Kelebihan lain ialah parameter dan parameter mudah disesuaikan dan dioptimumkan, pengguna boleh memilih untuk mengaktifkan parameter dan parameter yang berkaitan mengikut keperluan mereka sendiri.
Dari sudut pengurusan risiko, strategi ini memberi perhatian kepada kedua-dua garis purata cepat dan perlahan, yang dapat mengurangkan kebarangkalian isyarat palsu yang disebabkan oleh pergerakan harga.
Analisis risiko
Risiko utama strategi ini ialah:
Terlalu rumit, mudah menyebabkan konflik penunjuk, pilihan di bawah kombinasi parameter tertentu mungkin menyebabkan overfit.
Menggunakan sistem linear berbilang kumpulan, kerugian besar mungkin berlaku apabila pasaran berubah secara mendadak (seperti peristiwa ekonomi utama).
Pengesanan kedalaman yang tidak mencukupi, mungkin ada risiko bias survivalship dalam pertempuran sebenar.
Dalam proses penerapan, kita perlu memberi perhatian kepada pengurusan risiko, menyesuaikan saiz kedudukan dengan sewajarnya. Dan melakukan pengesanan berulang pada jangka masa yang lebih lama dan set data yang lebih besar untuk memastikan keberkesanan strategi dalam pertempuran.
Arah pengoptimuman strategi
Memandangkan kombinasi indikator strategi ini agak rumit dan mempunyai banyak parameter, ia boleh dioptimumkan dari beberapa aspek berikut:
Mempermudahkan pemilihan indikator dan menghilangkan indikator yang kurang relevan atau bertentangan.
Pilihan rata-rata IIR telah dioptimumkan untuk memilih panjang yang lebih sesuai dengan ciri pasaran.
Mengoptimumkan kombinasi garis rata-rata perlahan-lahan, meningkatkan kestabilan isyarat silang.
Meningkatkan penilaian yang dibantu oleh model pembelajaran mesin dan meningkatkan kemampuan penyesuaian strategi.
Mengoptimumkan kesesuaian dengan indeks global dan meningkatkan kejayaan penilaian trend.
ringkaskan
Dengan kombinasi dan pengoptimuman indikator yang fleksibel, strategi ini dapat mencerminkan keadaan pasaran dengan lebih menyeluruh dan memberikan sokongan pelbagai dimensi untuk membuat keputusan perdagangan. Tetapi terdapat juga risiko yang berlebihan dalam praktik dan data.
/*backtest
start: 2023-12-23 00:00:00
end: 2024-01-10 00:00:00
period: 1m
basePeriod: 1m
exchanges: [{"eid":"Futures_Binance","currency":"BTC_USDT"}]
*/

//The plotchar UP/DOWN Arrows  is the crossover of the fastest MA and fastest IIR MAs
//
//The dots at the bottom are the two simple averages crossing over
//
//The count over/under the candles is the count of bars that the SMAs on their
//respective resolution are fanning out.
//
//The colored background indicates a squeeze, lime=kinda tight : green=very tight squeeze.  based on the 3 IIRs
//
//To answer my own question in a forum, looking at the code, i couldn't figure out how to get it from another timeframe
//and run the same calculations with the same results.  My answer in the end was to scale the chosen MA length
//in the corresponding CurrentPeriod/ChosenMAPeriod proportion.  This results in the same line in the same place when browsing through the
//different time resolutions.  Somebody might find this invaluable
//
//The counts are for MA's fanning out, or going parabolic.  Theres IIRs, Almas, one done of the other.  A lot.
//The arrows above and below bars are from standard RSI numbers for OB/OS
//
//The IIRs changes color depending on their slope, which can be referenced easily with a variable.
//
//The backgrond on a bar-by-bar basis is colored when 2 sets of moving averages are in a squeeze, aka
//when price is consolidating.
//
//This aims to help the trader combine conditions and entry criteria of the trade and explore these options visually.
//They detail things from all time-frames on the current one.  I prefer it because of the fractal nature of price-action, both large and small,
//either yesterday or last year.  For best results, go long in short-term trades when the long-term trend is also up.
//and other profitable insights.  This is also a great example of an automation algorith.
//
//The pretty ribbon is my script called 'Trading With Colors'. Use them together for fanciest results.  55/233 is my Fib Cross (golden/death)  Compare it to the classic 50/200 if
//you get bored.  I believe it simply works better, at least for Crypto.
//
//Evidently, I am a day-trader.  But this yields higher profits on larger time-frames anyways, so do play around with it. Find what works for you.

//Thanks and credit for code snippets goes to:
//matryskowal
//ChrisMoody, probably twice
//Alex Orekhov (everget)
//author=LucF and midtownsk8rguy, for PineCoders
//If you use code from this, real quick search for perhaps the original and give them a shoutout too.  I may have missed something

//Author: Sean Duffy
//@version=4
strategy(title = "Combination Parabolic MA/IIR/ALMA Strategy",
         shorttitle = "MA-QuickE",
         overlay = true )
        //  calc_on_order_fills = true,
        //  calc_on_every_tick = true,
// Input Variables
showFIBMAs = input(false, type=input.bool, title="═══════════════ Show Fibby MAs ═══════════════")
maRes = input(960, type=input.integer, title="MA-Cross Resolution")
mal1 = input(8, type=input.integer, title="MA#1 Length")
mal2 = input(13, type=input.integer, title="MA#2 Length")
mal3 = input(34, type=input.integer, title="MA#3 Length")
loosePercentClose = input(1.1, type=input.float, title="SMA LooseSqueeze Percent")
showIIRs = input(false, type=input.bool, title="═══════════════════ Show IIRs ═══════════════════")
iirRes = input(60, type=input.integer, title="IIR Resolution")
percentClose = input(title="IIR Squeeze PercentClose", type=input.float, defval=.8)
iirlength1 = input(title="IIR Length 1", type=input.integer, defval=34)
iirlength2 = input(title="IIR Length 2", type=input.integer, defval=144)//input(title="ATR Period", type=input.integer, defval=1)
iirlength3 = input(title="IIR Length 3", type=input.integer, defval=720)//input(title="ATR Period", type=input.integer, defval=1)
showIIR1 = input(true, type=input.bool, title="Show IIR1")
showIIR2 = input(true, type=input.bool, title="Show IIR2")
showIIR3 = input(true, type=input.bool, title="Show IIR3")
showCounts = input(true, type=input.bool, title="═════════════ Show Parabolic MA Counts ════════════")
showSignals = input(true, type=input.bool, title="══════════════ Show Buy/Sell Signals ══════════════")
showBackground = input(true, type=input.bool, title="══════════════ Show Background Colors ══════════════")
//runStrategy = input(true, type=input.bool, title="══════════════ Run Strategy  ══════════════")
debug = input(false, type=input.bool, title="══════════════ Show Debug ══════════════")

barLookbackPeriod = input(title="══ Bar Lookback Period ══", type=input.integer, defval=5)
percentageLookbackPeriod = input(title="══ Percentage Lookback Period ══", type=input.integer, defval=1)

bullcolor = color.green
bearcolor = color.red
color bgcolor = na

var bool slope1Green = na
var bool slope2Green = na
var bool slope3Green = na

var bool buySignal = na
var bool sellSignal = na
var bool bigbuySignal = na
var bool bigsellSignal = na
bool smbuySignal = false
bool smsellSignal = false
var bool insqueeze = na
var bool intightsqueeze = na
var bool infastsqueeze = na
var bool awaitingEntryIn = false

// My counting variables
var int count1 = 0
var float madist1 = 0
var int count2 = 0
var float madist2 = 0
var int sinceSmSignal = 0

var entryPrice = 0.0
var entryBarIndex = 0
var stopLossPrice = 0.0
// var updatedEntryPrice = 0.0
// var alertOpenPosition = false
// var alertClosePosition = false
// var label stopLossPriceLabel = na
// var line stopLossPriceLine = na
positionType = "LONG" // Strategy type, and the only current option

hasOpenPosition = strategy.opentrades != 0
hasNoOpenPosition = strategy.opentrades == 0

strategyClose() =>
    if (hasOpenPosition)
        if positionType == "LONG"
            strategy.close("LONG", when=true)
        else
            strategy.close("SHORT", when=true)
strategyOpen() =>
    if (hasNoOpenPosition)
        if positionType == "LONG"
            strategy.entry("LONG", strategy.long, when=true)
        else
            strategy.entry("SHORT", strategy.short, when=true)
checkEntry() =>
    buysignal = false
    if (hasNoOpenPosition)
        strategyOpen()
        buysignal := true
    // if (slope1Green and (trend1Green or trend2Green) and awaitingEntryIn and hasNoOpenPosition)
    //     strategyOpen()
    //     buysignal := true
    buysignal
checkExit() =>
    sellsignal = false
    // if (trend1Green == false and trend2Green == false) // to later have quicker exit strategy
    //     sellsignal := true
    //     strategyClose()
    if (hasOpenPosition)
        sellsignal := true
        strategyClose()
    sellsignal

multiplier(_adjRes, _adjLength) => // returns adjusted length
    multiplier = _adjRes/timeframe.multiplier
    round(_adjLength*multiplier)


//reset the var variables before new calculations
buySignal := false
sellSignal := false
smbuySignal := false
smsellSignal := false
bigbuySignal := false
bigsellSignal := false

ma1 = sma(close, multiplier(maRes, mal1))
ma2 = sma(close, multiplier(maRes, mal2))
ma3 = sma(close, multiplier(maRes, mal3))


madist1 := abs(ma1 - ma2)
madist2 := abs(ma1 - ma3) // check if MA's are fanning/going parabolic
if (ma1 >= ma2 and ma2 >= ma3 and madist1[0] > madist1[1]) //and abs(dataB - dataC >= madist2)  // dataA must be higher than b, and distance between gaining, same with C
    count1 := count1 + 1
else
    count1 := 0
if (ma1 <= ma2 and ma2 <= ma3 and madist1[0] > madist1[1])  //<= madist2 and dataB <= dataC) //and abs(dataB - dataC >= madist2)  // dataA must be higher than b, and distance between gaining, same with C
    count2 := count2 + 1
else
    count2 := 0


crossoverAB = crossover(ma1, ma2)
crossunderAB = crossunder(ma1, ma2)

plot(showFIBMAs ? ma1 : na, linewidth=3)
plot(showFIBMAs ? ma2 : na)
plot(showFIBMAs ? ma3 : na)


// Fast Squeese Check WORK IN PROGRESS
//
float singlePercent = close / 100
if max(madist1, madist2) <= singlePercent*loosePercentClose
    bgcolor := color.yellow
    infastsqueeze := true
else
    infastsqueeze := false


// IIR MOVING AVERAGE
f(a) => a[0] // fixes mutable error
iirma(iirlength, iirsrc) =>
    cf = 2*tan(2*3.14159*(1/iirlength)/2)
    a0 = 8 + 8*cf + 4*pow(cf,2) + pow(cf,3)
    a1 = -24 - 8*cf + 4*pow(cf,2) + 3*pow(cf,3)
    a2 = 24 - 8*cf - 4*pow(cf,2) + 3*pow(cf,3)
    a3 = -8 + 8*cf - 4*pow(cf,2) + pow(cf,3)
    //----
    c = pow(cf,3)/a0
    d0 = -a1/a0
    d1 = -a2/a0
    d2 = -a3/a0
    //----
    out = 0.
    out := nz(c*(iirsrc + iirsrc[3]) + 3*c*(iirsrc[1] + iirsrc[2]) + d0*out[1] + d1*out[2] + d2*out[3],iirsrc)
    f(out)


iirma1 = iirma(multiplier(iirRes, iirlength1), close)
iirma2 = iirma(multiplier(iirRes, iirlength2), close)
iirma3 = iirma(multiplier(iirRes, iirlength3), close)

// adjusts length for current resolution now, length is lengthened/shortened accordingly, upholding exact placement of lines
// iirmaD1 = security(syminfo.tickerid, tostring(iirRes), iirma1, barmerge.gaps_on, barmerge.lookahead_on)
// iirmaD2 = security(syminfo.tickerid, tostring(iirRes), iirma2, barmerge.gaps_on, barmerge.lookahead_on)
// iirmaD3 = security(syminfo.tickerid, tostring(iirRes), iirma3, barmerge.gaps_on, barmerge.lookahead_on)

slope1color = slope1Green ? color.lime : color.blue
slope2color = slope2Green ? color.lime : color.blue
slope3color = slope3Green ? color.lime : color.blue

plot(showIIR1 and showIIRs ? iirma1 : na, title="IIR1", color=slope1color, linewidth=2, transp=30)
plot(showIIR2 and showIIRs ? iirma2 : na, title="IIR2", color=slope2color, linewidth=3, transp=30)
plot(showIIR3 and showIIRs ? iirma3 : na, title="IIR3", color=slope3color, linewidth=4, transp=30)

// checks slope of IIRs to create a boolean variable and and color it differently
if (iirma1[0] >= iirma1[1])
    slope1Green := true
else
    slope1Green := false
if (iirma2[0] >= iirma2[1])
    slope2Green := true
else
    slope2Green := false
if (iirma3[0] >= iirma3[1])
    slope3Green := true
else
    slope3Green := false

// calculate space between IIRs and then if the price jumps above both
//float singlePercent = close / 100  // = a single percent
var float distIIR1 = na
var float distIIR2 = na
distIIR1 := abs(iirma1 - iirma2)
distIIR2 := abs(iirma1 - iirma3)

if (distIIR1[0] < percentClose*singlePercent and close[0] >= iirma1[0])
    if close[0] >= iirma2[0] and close[0] >= iirma3[0]
        bgcolor := color.green
        insqueeze := true
        intightsqueeze := true
    else
        bgcolor := color.lime
        insqueeze := true
        intightsqueeze := false
else
    insqueeze := false
    intightsqueeze := false


// if (true)//sinceSmSignal > 0) //  cutting down on fastest MAs noise
//     sinceSmSignal := sinceSmSignal + 1
//     if (crossoverAB)
//         //checkEntry()
//         //smbuySignal := true
//         sinceSmSignal := 0
//     if (crossunderAB) // and all NOT greennot (slope1Green and slope2Green and slope3Green)
//         //checkExit()
//         //smsellSignal := true
//         sinceSmSignal := 0
// else
//     sinceSmSignal := sinceSmSignal + 1


f_draw_infopanel(_x, _y, _line, _text, _color)=>
    _rep_text = ""
    for _l = 0 to _line
        _rep_text := _rep_text + "\n"
    _rep_text := _rep_text + _text
    var label _la = na
    label.delete(_la)
    _la := label.new(
         x=_x, y=_y,
         text=_rep_text, xloc=xloc.bar_time, yloc=yloc.price,
         color=color.black, style=label.style_labelup, textcolor=_color, size=size.normal)

posx = timenow + round(change(time)*60)
posy = highest(50)

// CONSTRUCTION ZONE
// TODO:  program way to eliminate noise and false signals
// MAYBEDO: program it to differentiate between a moving average bump and a cross
//          I think the best way would be to calculate the tangent line... OR
//          Take the slope of both going back a couple bars and if it's close enough, its a bounce off
//          and an excellent entry signal
// program in quickest exit, 2 bars next to eachother both closing under, as to avoid a single wick from
// prompting to close the trade
// Some other time, have it move SMA up or down depending on whether trending up or down.  Then use those MA crosses

//THIS CHECKS THE SLOPE FROM CURRENT PRICE TO BACK 10 BARS
checkSlope(_series) =>  (_series[0]/_series[10])*100 // it now returns it as a percentage

doNewX = input(true, type=input.bool, title="══════════ Show misc MA Cross Strategy ══════════")

iirX = input(555, title="IIRx Length: ", type=input.integer)
iirXperiod = input(30, title="IIRx Period/TF: ", type=input.integer)

iirX2 = input(13, title="IIRx2 Length: ", type=input.integer)
iirX2period = input(5, title="IIRx2 Period/TF: ", type=input.integer) //15

almaXperiod = input(defval=15, title="Alma of IIR1 Period: ", type=input.integer)
almaXalpha = input(title="Alma Alpha Value: ", defval=.7, maxval=.95, type=input.float) // dont forget to try .99
almaXsigma = input(title="Alma Sigma Value: ", defval=500, type=input.float)

iirmaOTF = iirma(multiplier(iirXperiod, iirX), close)
iirma2OTF = iirma(multiplier(iirX2period, iirX2), close)
smaOTF = alma(iirmaOTF, almaXperiod, almaXalpha, almaXsigma) // maybe dont touch, its precise  // I took the ALMA of the IIRMA, and i hope thats not cheating ;)

// I could have removed this.  the multiplier function adjusts the length to fit the current timeframe while displaying the same
// smaXOTF = security(syminfo.tickerid, smaXperiod, smaOTF, barmerge.gaps_on, barmerge.lookahead_on)
// iirmaXOTF = security(syminfo.tickerid, iirXperiod, iirmaOTF, barmerge.gaps_on, barmerge.lookahead_on)
// iirmaX2OTF = security(syminfo.tickerid, iirX2period, iirma2OTF, barmerge.gaps_on, barmerge.lookahead_on)
plot(doNewX ? smaOTF : na, title="FastMA X-Over :  ", color=color.blue, linewidth=1, transp=40)
plot(doNewX ? iirmaOTF : na, title="IIR MAx :  ", color=color.purple, linewidth=1, transp=30)
plot(doNewX ? iirma2OTF : na, title="IIR MAx :  ", color=color.purple, linewidth=2, transp=20)

iirma2Up = checkSlope(iirma2OTF) > 0 // just another slope up/down variable.

//calculate spaces between averages
distiiralma = abs(iirmaOTF - smaOTF)

crossoverFast = crossover(iirmaOTF, smaOTF) // and (iirmaOTF[1] <= smaOTF[1])
crossunderFast = crossunder(iirmaOTF, smaOTF) // and (iirmaOTF[1] >= smaOTF[1])

if (crossoverFast and iirma2Up == true and infastsqueeze == false and intightsqueeze == false) // and (count1 != 0))// or close[0] < (lowest(barLookbackPeriod) + singlePercent*3))) // must be at most a few percent up from a recent low.  Avoid buying highs :P
    buySignal := true
    strategyOpen()
    // if (slope1Green and slope2Green and slope3Green and infastsqueeze == false)
    //     checkEntry()
if (crossunderFast)
    sellSignal := true
    checkExit()

// I feel like I didn't cite the OG author for this panel correctly. I hope I did, but there are extentions of his/her work in multiple places.
// I could have gotten it confused.
if (debug)
    f_draw_infopanel(posx, posy, 18, "distiiralma from IIR: " + tostring(distiiralma), color.lime)
    //f_draw_infopanel(posx, posy, 16, "distiirs: " + tostring(distiirX1), color.lime)
    f_draw_infopanel(posx, posy, 14, "Value of iirmaOTF: " + tostring(iirmaOTF), color.lime)
    f_draw_infopanel(posx, posy, 6, "slope X: " + tostring(abs(100 - checkSlope(iirmaOTF))), color.lime)
    f_draw_infopanel(posx, posy, 12, "value of smaOTF: " + tostring(smaOTF), color.lime)
    f_draw_infopanel(posx, posy, 6, "slopeAlma: " + tostring(abs(100 - checkSlope(smaOTF))), color.lime)
    f_draw_infopanel(posx, posy, 2, "slopeIIR2 " + tostring(abs(100 - checkSlope(iirma2OTF))), color.lime)
    f_draw_infopanel(posx, posy, 2, "slopeIIR2 " + tostring(abs(100 - checkSlope(iirma2OTF))), color.lime)


// I kept this separate because it discludes the calculations.  Its hard to hold a train of thought while fishing for the right section
bgcolor(showBackground ? bgcolor : na)
plotshape(showSignals ? buySignal : na, location=location.bottom, style=shape.circle, text="", size=size.tiny, color=color.blue, transp=60)
plotshape(showSignals ? sellSignal : na, location=location.bottom, style=shape.circle, text="", size=size.tiny, color=color.red, transp=60)
plotchar(showSignals and smbuySignal, title="smBuy", location=location.belowbar, char='↑', size=size.tiny, color=color.green, transp=0)
plotchar(showSignals and smsellSignal, title="smSell", location=location.abovebar, char='↓', size=size.tiny, color=color.orange, transp=0)

// can not display a variable. Can only match the count to a corresponding plotchar
// to display a non-constant variable, use the debug box, which was so kindly offered up by our community.
plotchar(showCounts and count1==1, title='', char='1', location=location.belowbar, color=#2c9e2c, transp=0)
plotchar(showCounts and count1==2, title='', char='2', location=location.belowbar, color=#2c9e2c, transp=0)
plotchar(showCounts and count1==3, title='', char='3', location=location.belowbar, color=#2c9e2c, transp=0)
plotchar(showCounts and count1==4, title='', char='4', location=location.belowbar, color=#2c9e2c, transp=0)
plotchar(showCounts and count1==5, title='', char='5', location=location.belowbar, color=#2c9e2c, transp=0)
plotchar(showCounts and count1==6, title='', char='6', location=location.belowbar, color=#2c9e2c, transp=0)
plotchar(showCounts and count1==7, title='', char='7', location=location.belowbar, color=#2c9e2c, transp=0)
plotchar(showCounts and count1==8, title='', char='8', location=location.belowbar, color=#2c9e2c, transp=0)
plotchar(showCounts and count1==9, title='', char='9', location=location.belowbar, color=#2c9e2c, transp=0)
plotchar(showCounts and count1>=10, title='', char='$', location=location.belowbar, color=#2c9e2c, transp=0)

plotchar(showCounts and count2==1, title='', char='1', location=location.abovebar, color=#e91e63, transp=0)
plotchar(showCounts and count2==2, title='', char='2', location=location.abovebar, color=#e91e63, transp=0)
plotchar(showCounts and count2==3, title='', char='3', location=location.abovebar, color=#e91e63, transp=0)
plotchar(showCounts and count2==4, title='', char='4', location=location.abovebar, color=#e91e63, transp=0)
plotchar(showCounts and count2==5, title='', char='5', location=location.abovebar, color=#e91e63, transp=0)
plotchar(showCounts and count2==6, title='', char='6', location=location.abovebar, color=#e91e63, transp=0)
plotchar(showCounts and count2==7, title='', char='7', location=location.abovebar, color=#e91e63, transp=0)
plotchar(showCounts and count2==8, title='', char='8', location=location.abovebar, color=#e91e63, transp=0)
plotchar(showCounts and count2==9, title='', char='9', location=location.abovebar, color=#e91e63, transp=0)
plotchar(showCounts and count2>=10, title='', char='$', location=location.abovebar, color=#e91e63, transp=0)

showRSIind = input(true, type=input.bool, title="═══════════════════ Show RSI Arrows ═══════════════════")
// Get user input
rsiSource = input(title="RSI Source", type=input.source, defval=close)
rsiLength = input(title="RSI Length", type=input.integer, defval=14)
rsiOverbought = input(title="RSI Overbought Level", type=input.integer, defval=80)
rsiOversold = input(title="RSI Oversold Level", type=input.integer, defval=20)
// Get RSI value
rsiValue = rsi(rsiSource, rsiLength)
isRsiOB = rsiValue >= rsiOverbought
isRsiOS = rsiValue <= rsiOversold
// Plot signals to chart
plotshape(isRsiOB, title="Overbought", location=location.abovebar, color=color.red, transp=0, style=shape.triangledown)
plotshape(isRsiOS, title="Oversold", location=location.belowbar, color=color.green, transp=0, style=shape.triangleup)

//reset the var variables before new calculations
buySignal := false
sellSignal := false
smbuySignal := false
smsellSignal := false
bigbuySignal := false
bigsellSignal := false