Strategi kuantitatif berdasarkan pivot Kamachira dan jalur Bollinger

1
Follow
1782
Followers
Gambaran keseluruhan
Strategi ini mula-mula mengira titik pusat Kamachila berdasarkan harga tertinggi, terendah, dan harga penutupan pada hari perdagangan sebelumnya. Kemudian, ia menapis harga dengan penunjuk Bollinger Bands dan menghasilkan isyarat perdagangan apabila harga menembusi titik pusat.
Prinsip Strategi
- Hitung harga tertinggi, terendah, dan penutupan pada hari perdagangan sebelumnya
- Kaedah untuk mengira sumbu Kamakura yang terdiri daripada H4, H3, H2, H1 dan L1, L2, L3 dan L4
- Berhitung 20 hari Brin naik dan turun
- Buat lebih apabila harga naik dan turun, buat kosong apabila turun
- Titik hentian terletak berhampiran jalur atas atau bawah Brin
Analisis kelebihan
- Axis Kamachila mengandungi beberapa titik rintangan sokongan utama untuk meningkatkan kebolehpercayaan isyarat perdagangan
- Gabungan dengan penunjuk Brin, penapis penembusan palsu yang berkesan
- Pelbagai set parameter, fleksibiliti perdagangan
Analisis risiko
- Seting parameter penunjuk tali pinggang Brin yang tidak betul boleh menyebabkan kesilapan isyarat perdagangan
- Bilangan titik kritikal pada aksen Kamachila bergantung kepada harga pada hari perdagangan sebelumnya, yang mungkin dipengaruhi oleh lompatan malam
- Operasi Berbilang Kepala Bebas Berhadapan Risiko Kerugian
Arah pengoptimuman
- Mengoptimumkan parameter Brin untuk mencari kombinasi parameter yang terbaik
- Penapisan penembusan palsu yang digabungkan dengan petunjuk lain
- Meningkatkan strategi penangguhan kerugian dan mengurangkan kerugian tunggal
ringkaskan
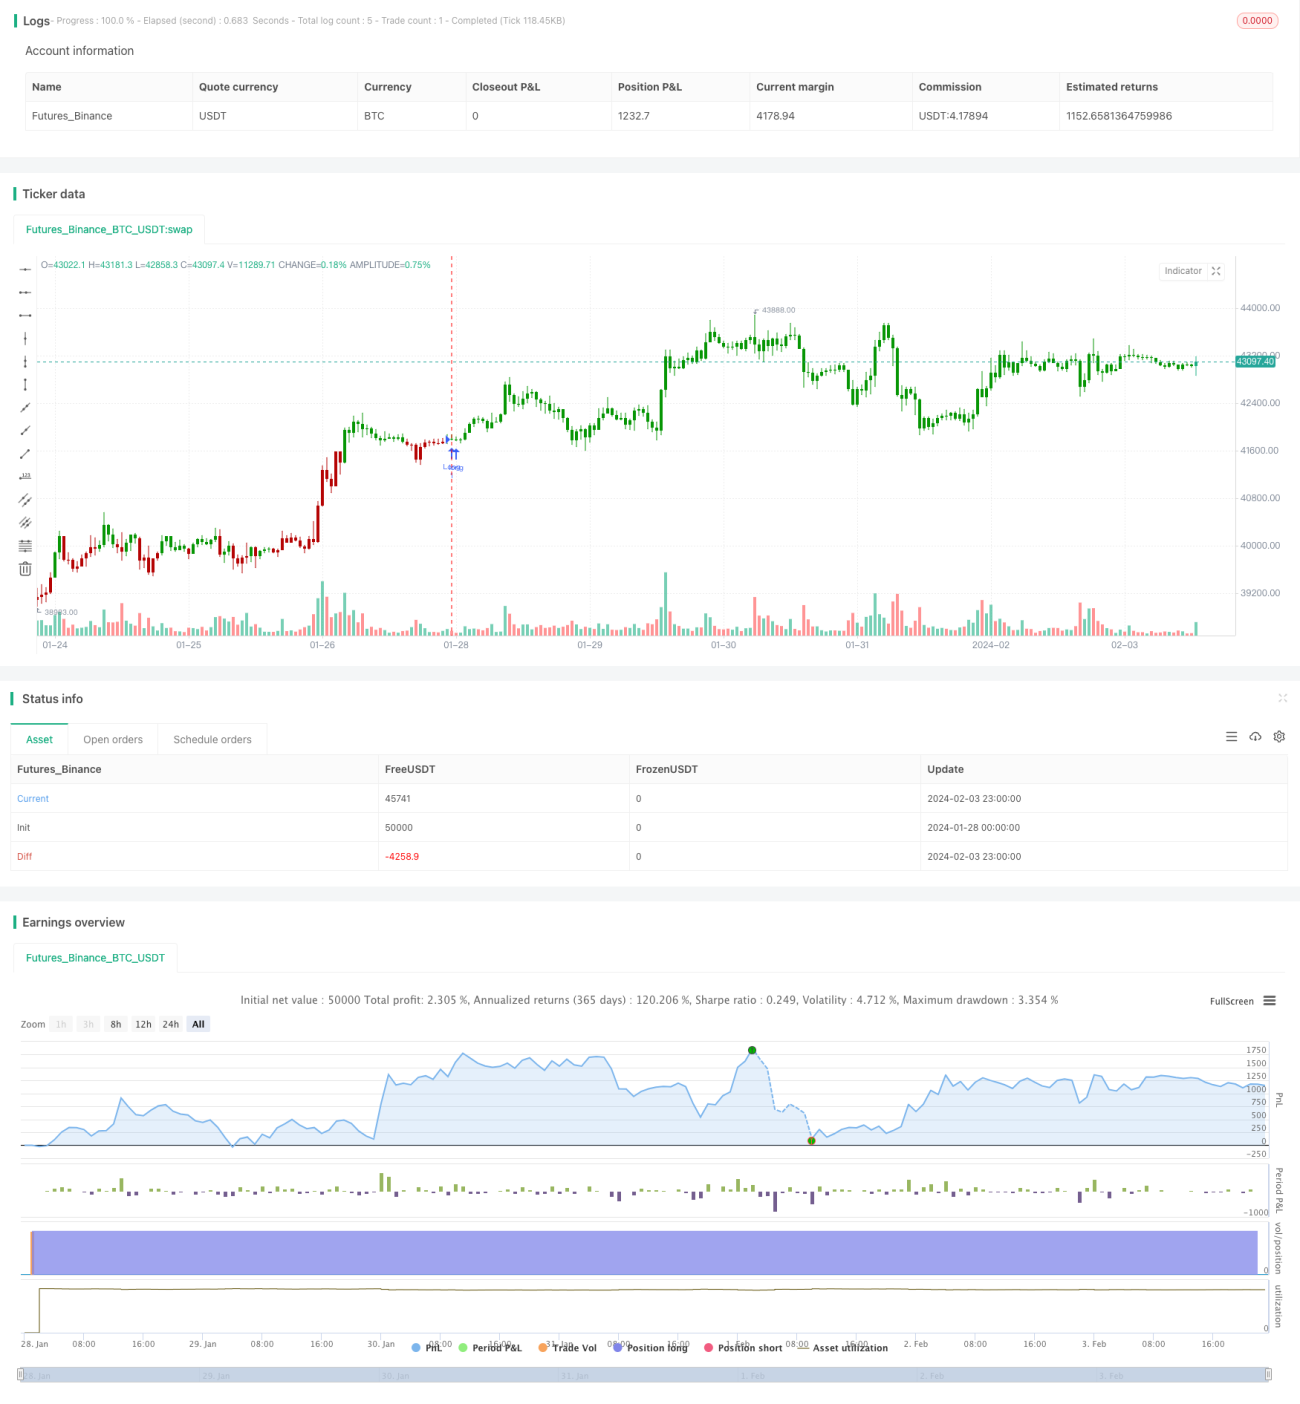
Strategi ini menggunakan integrasi Kacamatera Axis dan Bollinger Bands untuk menghasilkan isyarat perdagangan apabila harga menembusi tahap rintangan sokongan utama. Keuntungan dan kestabilan strategi dapat ditingkatkan melalui pengoptimuman parameter dan penapisan isyarat. Secara keseluruhan, strategi ini jelas, dapat dikendalikan, dan layak untuk diuji secara langsung.
Source
Pine
/*backtest
start: 2024-01-28 00:00:00
end: 2024-02-04 00:00:00
period: 1h
basePeriod: 15m
exchanges: [{"eid":"Futures_Binance","currency":"BTC_USDT"}]
*/

//@version=4
////////////////////////////////////////////////////////////
//  Copyright by HPotter v1.0 12/05/2020
// Camarilla pivot point formula is the refined form of existing classic pivot point formula. Strategy parameters
Related strategies
Comment
All comments (0)
No data
- 1