Strategi henti rugi mengekori Supertrend berdasarkan Heikin Ashi
Gambaran Keseluruhan Strategi
Strategi ini adalah strategi penarikan trend yang digabungkan dengan Heikin Ashi Threshold dan Super Trend Indicator. Ia menggunakan Heikin Ashi Threshold untuk menyaring kebisingan pasaran, Super Trend Indicator untuk menentukan arah trend, dan menggunakan Super Trend sebagai garis penarikan yang dinamik untuk mendapatkan penarikan trend dan kawalan risiko yang cekap.
Prinsip Strategi
- Hitung garis Heikin Ashi: termasuk harga bukaan, harga tutup, harga tertinggi, harga terendah.
- Pengiraan indikator super trend: Pengiraan atas dan bawah landasan berdasarkan ATR dan harga.
- Menggabungkan garis Heikin Ashi dan super trend untuk menentukan arah trend.
- Trend bullish apabila harga penutupan Heikin Ashi lebih dekat ke arah atas daripada harga penutupan garis K sebelumnya yang lebih dekat ke arah atas daripada trend super; trend bearish apabila harga penutupan Heikin Ashi lebih dekat ke arah bawah daripada harga penutupan garis K sebelumnya yang lebih dekat ke arah bawah daripada trend super.
- Dalam trend bullish, dengan super trend atas landasan sebagai mengesan garis berhenti; dalam trend penurunan, dengan super trend bawah landasan sebagai mengesan garis berhenti.
Kelebihan Strategik
- Dengan menggunakan penapis Heikin Ashi, penembusan palsu dapat digunakan untuk mengenal pasti isyarat trend dengan lebih yakin.
- Supertrend berfungsi sebagai stop loss yang dinamik untuk mengunci keuntungan trend dan mengelakkan pulangan balik yang terlalu besar.
- Gabungan dengan tempoh masa yang berbeza untuk menilai ruang kosong, mengesahkan isyarat rendah tinggi lebih dipercayai.
- Fungsi set masa untuk mengelakkan kesan tindakan tidak rasional pada masa tertentu.
Risiko Strategik
- Apabila trend berbalik, ia mudah dihentikan. Garis berhenti boleh dikurangkan untuk mengurangkan risiko ini.
- Tetapan parameter Supertrend yang tidak betul boleh menyebabkan stop loss terlalu lebar atau terlalu sempit. Kombinasi parameter yang berbeza boleh diuji.
- Masalah pengurusan wang tidak dipertimbangkan. Kawalan kedudukan harus ditetapkan.
- Kos urus niaga tidak diambil kira. Kesan kos perlu diukur.
Arah pengoptimuman strategi
- Mengoptimumkan kombinasi parameter super trend untuk mencari parameter yang optimum.
- Menambah kawalan kedudukan.
- Menambah pertimbangan kos, seperti yuran, slippage, dan sebagainya.
- Stop loss boleh disesuaikan mengikut trend yang kuat atau lemah.
- Pertimbangkan untuk memfilterkan isyarat masuk bersama-sama dengan petunjuk lain.
ringkaskan
Strategi ini mengintegrasikan kelebihan kedua-dua petunjuk Heikin Ashi dan Supertrend, dapat menangkap arah trend, sambil menggunakan supertrend untuk mengotomatiskan tracking stop loss, sehingga dapat mengunci keuntungan trend. Risiko strategi terutama berasal dari pembalikan trend dan pengoptimuman parameter, kedua-duanya dapat diperbaiki dengan pengoptimuman lanjut. Secara keseluruhan, strategi ini menggunakan integrasi petunjuk untuk meningkatkan kestabilan dan ruang keuntungan sistem perdagangan.
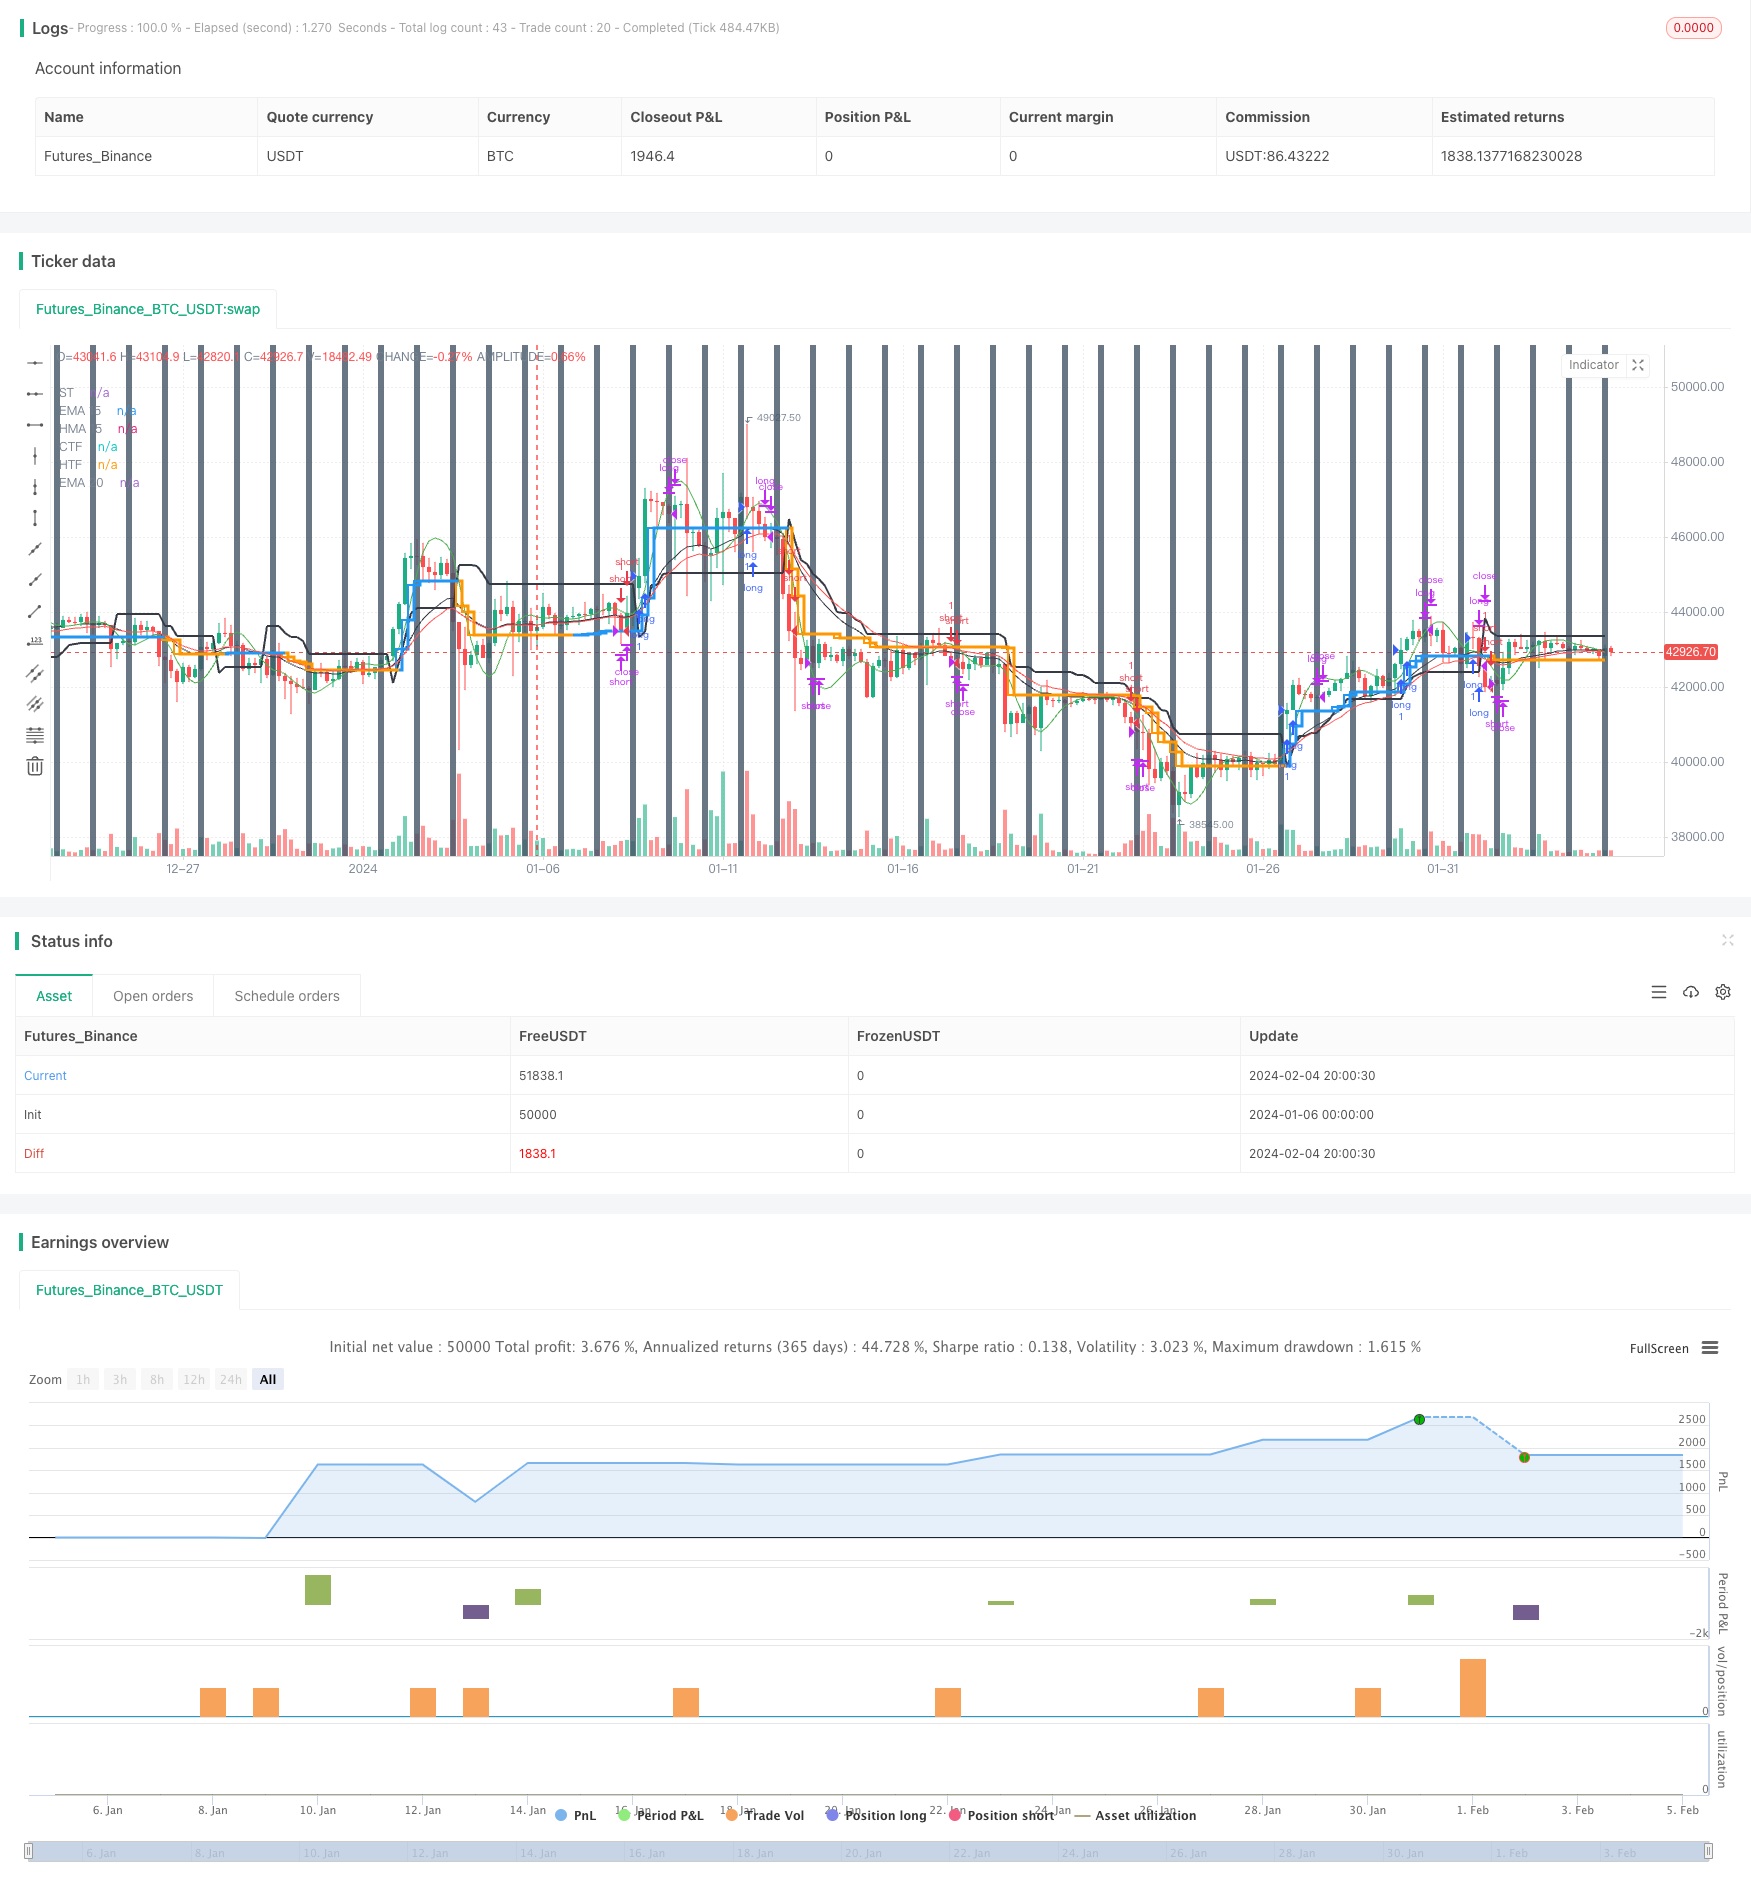
/*backtest
start: 2024-01-06 00:00:00
end: 2024-02-05 00:00:00
period: 4h
basePeriod: 15m
exchanges: [{"eid":"Futures_Binance","currency":"BTC_USDT"}]
*/

// This source code is subject to the terms of the Mozilla Public License 2.0 at https://mozilla.org/MPL/2.0/
// © ringashish

//@version=4
strategy("sa-strategy with HTF-TSL", overlay=true)


Pd = input(title="ATR Period", type=input.integer, defval=4)
Factor = input(title="ATR Multiplier", type=input.float, step=0.1, defval=2)
ST= supertrend(Factor, Pd)

heikinashi_close = security(heikinashi(syminfo.tickerid), timeframe.period, close)
heikinashi_low = security(heikinashi(syminfo.tickerid), timeframe.period, low)
heikinashi_open = security(heikinashi(syminfo.tickerid), timeframe.period, open)
heikinashi_high = security(heikinashi(syminfo.tickerid), timeframe.period, high)

heikinashi_close30 = security(heikinashi(syminfo.tickerid), "30", close)
//res1 = input("30", type=input.resolution, title="higher Timeframe")


//CCI TSL

res = input("240",type=input.resolution,title = "Higher Time Frame")
CCI = input(20)
ATR = input(5)
Multiplier=input(1,title='ATR Multiplier')
original=input(false,title='original coloring')
thisCCI = cci(close, CCI)
lastCCI = nz(thisCCI[1])


calcx()=>
    bufferDn= high + Multiplier * sma(tr,ATR)
    bufferUp= low - Multiplier * sma(tr,ATR)
    if (thisCCI >= 0 and lastCCI < 0)
        bufferUp := bufferDn[1]
    if (thisCCI <= 0 and lastCCI > 0)
        bufferDn := bufferUp[1]

    if (thisCCI >= 0)
        if (bufferUp < bufferUp[1])
            bufferUp := bufferUp[1]
    else
        if (thisCCI <= 0)
            if (bufferDn > bufferDn[1])
                bufferDn := bufferDn[1]


    x = 0.0
    x := thisCCI >= 0 ?bufferUp:thisCCI <= 0 ?bufferDn:x[1]
    x

tempx = calcx()

calcswap() =>
    swap = 0.0
    swap := tempx>tempx[1]?1:tempx<tempx[1]?-1:swap[1]
    swap

tempswap = calcswap()

swap2=tempswap==1?color.blue:color.orange
swap3=thisCCI >=0 ?color.blue:color.orange
swap4=original?swap3:swap2

//display current timeframe's Trend

plot(tempx,"CTF",color=swap4,transp=0,linewidth=2, style = plot.style_stepline)


htfx = security(syminfo.tickerid,res,tempx[1],lookahead = barmerge.lookahead_on)
htfswap4 = security(syminfo.tickerid,res,swap4[1],lookahead = barmerge.lookahead_on)

plot(htfx,"HTF",color=htfswap4,transp=0,linewidth=3,style = plot.style_stepline)


//supertrend
Supertrend(Factor, Pd) =>
    Up=hl2-(Factor*atr(Pd))
    Dn=hl2+(Factor*atr(Pd))

    TrendUp = 0.0
    TrendUp := heikinashi_close[1]>TrendUp[1] ? max(Up,TrendUp[1]) : Up
    TrendDown = 0.0
    TrendDown := heikinashi_close[1]<TrendDown[1]? min(Dn,TrendDown[1]) : Dn
    Trend = 0.0
    Trend := heikinashi_close > TrendDown[1] ? 1: heikinashi_close< TrendUp[1]? -1: nz(Trend[1],1)
    Tsl = Trend==1? TrendUp: TrendDown

    S_Buy = Trend == 1 ? 1 : 0
    S_Sell = Trend != 1 ? 1 : 0

    [Trend, Tsl]

[Trend,Tsl] = Supertrend(Factor, Pd)
// Security
//ST1_Trend_MTF = security(syminfo.tickerid, res1, Tsl,barmerge.lookahead_on)
//plot(ST1_Trend_MTF, "higher ST")

crossdn = crossunder(heikinashi_close,Tsl) or crossunder(heikinashi_close[1],Tsl) or crossunder(heikinashi_close[2],Tsl) or heikinashi_close < Tsl
crossup = crossover(heikinashi_close,Tsl) or crossover(heikinashi_close[1],Tsl) or crossover(heikinashi_close[2],Tsl) or heikinashi_close > Tsl
plot(Tsl,"ST",color = color.black,linewidth =2)
plot(ema(heikinashi_close,20),"EMA 20",color=color.red)
plot(hma(heikinashi_close,15),"HMA 15",color=color.green)
plot(ema(heikinashi_close,15),"EMA 15",color=color.black)

closedown = (heikinashi_close < hma(heikinashi_close,15) and heikinashi_high > hma(heikinashi_close,15)) or(heikinashi_close < ema(heikinashi_close,20) and heikinashi_high > ema(heikinashi_close,20))
closeup = (heikinashi_close > hma(heikinashi_close,15) and heikinashi_low < hma(heikinashi_close,15)) or (heikinashi_close > ema(heikinashi_close,20) and heikinashi_low < ema(heikinashi_close,20))

buy = heikinashi_open == heikinashi_low and closeup and crossup  and close > htfx
//buy = heikinashi_open == heikinashi_low and heikinashi_close > ema(close,20) and heikinashi_low < ema(close,20) and crossup
buyexit = cross(close,tempx) //heikinashi_open == heikinashi_high //and heikinashi_close < ema(close,15) and heikinashi_high > ema(close,15)

//if heikinashi_close30[1] < ST1_Trend_MTF
//sell = heikinashi_open == heikinashi_high and heikinashi_close < ema(close,20) and heikinashi_high > ema(close,20) and rsi(close,14)<60 and crossdn
sell = heikinashi_open == heikinashi_high and closedown and rsi(close,14)<55 and crossdn  and close < htfx
sellexit = cross(close,tempx) //heikinashi_open == heikinashi_low //and heikinashi_close > ema(close,15) and heikinashi_low < ema(close,15)

rg = 0
rg := buy ? 1 : buyexit ? 2 : nz(rg[1])

longLogic = rg != rg[1] and rg == 1
longExit = rg != rg[1] and rg == 2

//plotshape(longExit,"exit buy",style = shape.arrowup,location = location.belowbar,color = color.red, text ="buy exit", textcolor = color.red)
//plotshape(longLogic,"BUY",style = shape.arrowup,location = location.belowbar,color = color.green, text ="buy", textcolor= color.green)

nm = 0
nm := sell ? 1 : sellexit ? 2 : nz(nm[1])

shortLogic = nm != nm[1] and nm == 1
shortExit = nm != nm[1] and nm == 2

//plotshape(shortExit,"exit sell",style = shape.arrowup,location = location.belowbar,color = color.red, text ="sell exit", textcolor = color.red)
//plotshape(shortLogic,"SELL",style = shape.arrowup,location = location.belowbar,color = color.green, text ="sell", textcolor= color.green)


//Exit at particular time

ExitHour = input(title="Exit Hour Of Day", type=input.integer, defval=15, step = 5, maxval = 24, minval = 0)
ExitMint = input(title="Exit Minute Of Day", type=input.integer, defval=15, step = 5, maxval = 24, minval = 0)
bgc = input(title="Highlight Background Color?", type=input.bool, defval=true)
mRound(num,rem) => (floor(num/rem)*rem)
exitTime = (hour(time) >= ExitHour and (minute == mRound(ExitMint, timeframe.multiplier))) ? 1 : 0
exitTime := exitTime == 0 ? (hour(time) >= ExitHour and (minute + timeframe.multiplier >= ExitMint)) ? 1 : 0 : exitTime

MarketClose =  exitTime and not exitTime[1]

alertcondition(exitTime and not exitTime[1], title="Intraday Session Close Time", message="Close All Positions")
bgcolor(exitTime and not exitTime[1] and bgc ? #445566 : na, transp =40)


longCondition = longLogic
if (longCondition)
    strategy.entry("long", strategy.long)


shortCondition = shortLogic
if (shortCondition)
    strategy.entry("short", strategy.short)


strategy.close("short", when =cross(close,tempx)  or MarketClose)
strategy.close( "long", when =cross(close,tempx) or MarketClose )