Strategi momentum pecah

Penulis:ChaoZhang, Tarikh: 2024-02-23 14:27:21
Tag:

img

Ringkasan

Strategi momentum breakout adalah strategi trend-mengikuti yang mengesan momentum pasaran. Ia menggabungkan beberapa penunjuk untuk menilai sama ada pasaran kini dalam trend menaik atau menurun, dan membuka kedudukan panjang apabila menembusi tahap rintangan utama dan membuka kedudukan pendek apabila menembusi tahap sokongan utama.

Logika Strategi

Strategi ini terutamanya menggunakan Saluran Donchian dari pelbagai bingkai masa untuk menentukan trend pasaran dan tahap harga utama. Khususnya, apabila harga menembusi rel atas Saluran Donchian jangka panjang seperti 40 hari, ia dinilai sebagai trend menaik. Bersama dengan penapis tambahan seperti paras tertinggi baru dalam setahun dan penyelarasan purata bergerak, isyarat panjang dicetuskan. Apabila harga menembusi rel bawah Saluran Donchian jangka panjang, ia dinilai sebagai trend menurun. Bersama dengan penapis seperti paras terendah baru dalam tahun, isyarat pendek dicetuskan.

Strategi ini menyediakan dua pilihan untuk kedudukan keluar: garisan pembatalan tetap dan kehilangan berhenti yang mengikuti. Garis pembatalan tetap menggunakan rel bawah / atas Saluran Donchian yang lebih pendek seperti 20 hari. Garis pembatalan berhenti yang mengikuti mengira garis stop loss dinamik setiap hari berdasarkan nilai ATR. Kedua-dua kaedah dapat mengawal risiko dengan berkesan.

Analisis Kelebihan

Strategi ini menggabungkan penilaian trend dan operasi pecah, yang dapat menangkap peluang arah jangka pendek di pasaran dengan berkesan. Berbanding dengan penunjuk tunggal, ia menggunakan pelbagai penapis yang dapat menapis beberapa pecah palsu dan meningkatkan kualiti isyarat kemasukan. Di samping itu, penerapan strategi stop loss juga meningkatkan daya tahannya dan dapat mengawal kerugian dengan berkesan walaupun pasaran menarik diri sebentar.

Analisis Risiko

Risiko utama strategi ini adalah bahawa harga boleh turun naik secara ganas, mencetuskan kerugian berhenti untuk keluar kedudukan. Jika harga berbalik dengan cepat selepas itu, peluang boleh terlepas. Di samping itu, penggunaan pelbagai penapis juga boleh menapis beberapa peluang dan mengurangkan kekerapan perdagangan.

Untuk mengurangkan risiko, kelipatan ATR boleh diselaraskan atau selang Saluran Donchian boleh diperluaskan untuk mengurangkan kebarangkalian kehilangan berhenti.

Arahan pengoptimuman

Strategi ini boleh dioptimumkan dalam aspek berikut:

  1. Mengoptimumkan panjang Saluran Donchian untuk mencari kombinasi parameter yang terbaik.
  2. Cuba pelbagai jenis purata bergerak sebagai penapis.
  3. Sesuaikan pengganda ATR atau gunakan titik tetap untuk stop loss.
  4. Tambah lebih banyak indikator penilaian trend seperti MACD.
  5. Mengoptimumkan tempoh melihat kembali untuk tertinggi / terendah baru dalam tahun dll.

Dengan menguji parameter yang berbeza, kombinasi risiko dan pulangan yang optimum dapat dijumpai.

Kesimpulan

Strategi ini menggabungkan pelbagai penunjuk untuk menentukan arah trend dan mencetuskan perdagangan pada tahap pecah utama. Mekanisme stop loss juga menjadikannya tahan terhadap risiko. Dengan mengoptimumkan parameter, pulangan berlebihan yang stabil dapat dicapai. Ia sesuai untuk pelabur yang tidak mempunyai pandangan yang jelas mengenai pasaran tetapi ingin mengikuti trend.


/*backtest
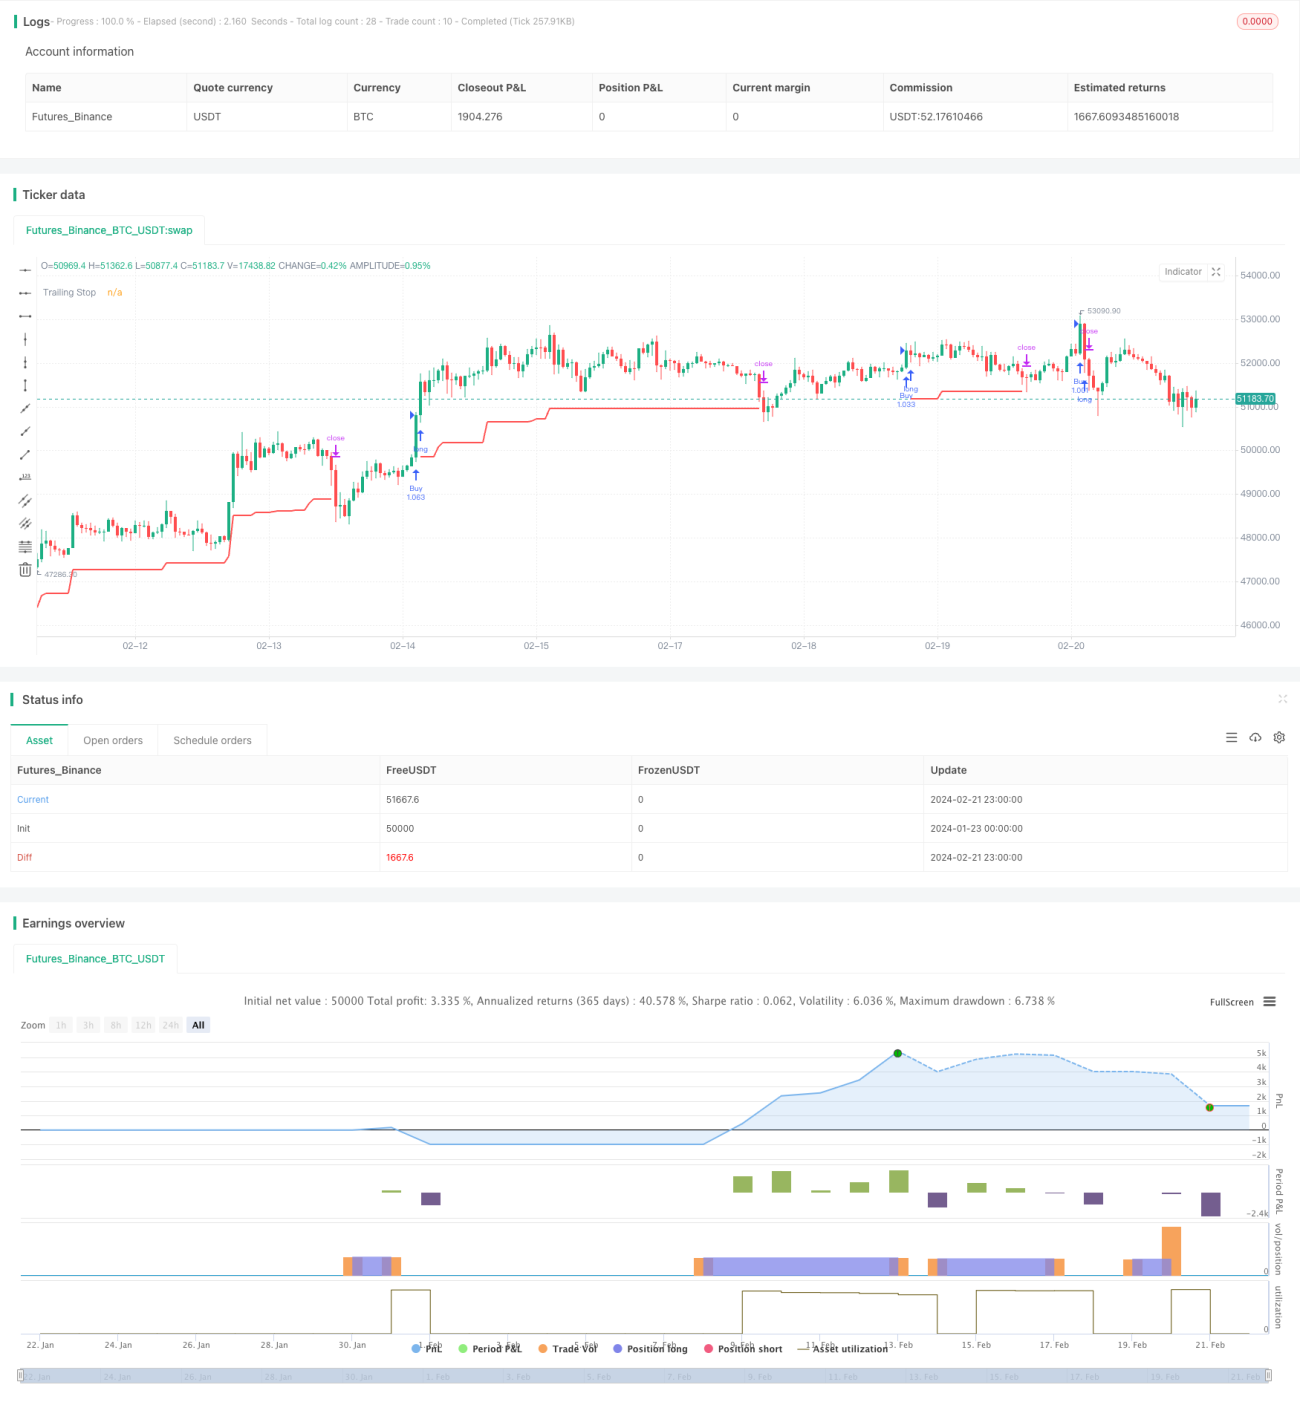
start: 2024-01-23 00:00:00
end: 2024-02-22 00:00:00
period: 1h
basePeriod: 15m
exchanges: [{"eid":"Futures_Binance","currency":"BTC_USDT"}]
*/

// This source code is subject to the terms of the Mozilla Public License 2.0 at https://mozilla.org/MPL/2.0/
// © HeWhoMustNotBeNamed

//@version=4
strategy("BuyHigh-SellLow Strategy", overlay=true, initial_capital = 10000, default_qty_type = strategy.percent_of_equity, default_qty_value = 100, commission_type = strategy.commission.percent, pyramiding = 1, commission_value = 0.01, calc_on_order_fills = true)
donchianEntryLength = input(40, step=10)
donchianExitLength = input(20, step=10)

considerNewLongTermHighLows = input(true)
shortHighLowPeriod = input(120, step=10)
longHighLowPeriod = input(180, step=10)

considerMAAlignment = input(true)
MAType = input(title="Moving Average Type", defval="ema", options=["ema", "sma", "hma", "rma", "vwma", "wma"])
LookbackPeriod = input(40, minval=10,step=10)

atrLength = input(22)
atrMult = input(4)

exitStrategy = input(title="Exit Strategy", defval="tsl", options=["dc", "tsl"])

considerYearlyHighLow = input(true)
backtestYears = input(10, minval=1, step=1)
f_getMovingAverage(source, MAType, length)=>
    ma = sma(source, length)
    if(MAType == "ema")
        ma := ema(source,length)
    if(MAType == "hma")
        ma := hma(source,length)
    if(MAType == "rma")
        ma := rma(source,length)
    if(MAType == "vwma")
        ma := vwma(source,length)
    if(MAType == "wma")
        ma := wma(source,length)
    ma

f_getTrailingStop(atr, atrMult)=>
    stop = close - atrMult*atr
    stop := strategy.position_size > 0 ? max(stop, stop[1]) : stop
    stop

f_getMaAlignment(MAType, includePartiallyAligned)=>
    ma5 = f_getMovingAverage(close,MAType,5)
    ma10 = f_getMovingAverage(close,MAType,10)
    ma20 = f_getMovingAverage(close,MAType,20)
    ma30 = f_getMovingAverage(close,MAType,30)
    ma50 = f_getMovingAverage(close,MAType,50)
    ma100 = f_getMovingAverage(close,MAType,100)
    ma200 = f_getMovingAverage(close,MAType,200)

    upwardScore = 0
    upwardScore := close > ma5? upwardScore+1:upwardScore
    upwardScore := ma5 > ma10? upwardScore+1:upwardScore
    upwardScore := ma10 > ma20? upwardScore+1:upwardScore
    upwardScore := ma20 > ma30? upwardScore+1:upwardScore
    upwardScore := ma30 > ma50? upwardScore+1:upwardScore
    upwardScore := ma50 > ma100? upwardScore+1:upwardScore
    upwardScore := ma100 > ma200? upwardScore+1:upwardScore
    
    upwards = close > ma5 and ma5 > ma10 and ma10 > ma20 and ma20 > ma30 and ma30 > ma50 and ma50 > ma100 and ma100 > ma200
    downwards = close < ma5 and ma5 < ma10 and ma10 < ma20 and ma20 < ma30 and ma30 < ma50 and ma50 < ma100 and ma100 < ma200
    upwards?1:downwards?-1:includePartiallyAligned ? (upwardScore > 5? 0.5: upwardScore < 2?-0.5:upwardScore>3?0.25:-0.25) : 0

//////////////////////////////////// Calculate new high low condition //////////////////////////////////////////////////
f_calculateNewHighLows(shortHighLowPeriod, longHighLowPeriod, considerNewLongTermHighLows)=>
    newHigh = highest(shortHighLowPeriod) == highest(longHighLowPeriod) or not considerNewLongTermHighLows
    newLow = lowest(shortHighLowPeriod) == lowest(longHighLowPeriod) or not considerNewLongTermHighLows
    [newHigh,newLow]

//////////////////////////////////// Calculate Yearly High Low //////////////////////////////////////////////////
f_getYearlyHighLowCondition(considerYearlyHighLow)=>
    yhigh = security(syminfo.tickerid, '12M', high[1]) 
    ylow = security(syminfo.tickerid, '12M', low[1]) 
    yhighlast = yhigh[365]
    ylowlast = ylow[365]
    yhighllast = yhigh[2 * 365]
    ylowllast = ylow[2 * 365]
    
    yearlyTrendUp = na(yhigh)? true : na(yhighlast)? close > yhigh : na(yhighllast)? close > max(yhigh,yhighlast) : close > max(yhigh, min(yhighlast, yhighllast))
    yearlyHighCondition = (  (na(yhigh) or na(yhighlast) ? true : (yhigh > yhighlast) ) and ( na(yhigh) or na(yhighllast) ? true : (yhigh > yhighllast))) or yearlyTrendUp or not considerYearlyHighLow
    yearlyTrendDown = na(ylow)? true : na(ylowlast)? close < ylow : na(ylowllast)? close < min(ylow,ylowlast) : close < min(ylow, max(ylowlast, ylowllast))
    yearlyLowCondition = (  (na(ylow) or na(ylowlast) ? true : (ylow < ylowlast) ) and ( na(ylow) or na(ylowllast) ? true : (ylow < ylowllast))) or yearlyTrendDown or not considerYearlyHighLow
    
    label_x = time+(60*60*24*1000*1)
    [yearlyHighCondition,yearlyLowCondition]

donchian(rangeLength)=>
    upper = highest(rangeLength)
    lower = lowest(rangeLength)
    middle = (upper+lower)/2
    [middle, upper, lower]

inDateRange = true
[eMiddle, eUpper, eLower] = donchian(donchianEntryLength)
[exMiddle, exUpper, exLower] = donchian(donchianExitLength)
maAlignment = f_getMaAlignment(MAType, false)
[yearlyHighCondition, yearlyLowCondition] = f_getYearlyHighLowCondition(considerYearlyHighLow)
[newHigh,newLow] = f_calculateNewHighLows(shortHighLowPeriod, longHighLowPeriod, considerNewLongTermHighLows)

maAlignmentLongCondition = highest(maAlignment, LookbackPeriod) == 1 or not considerMAAlignment 

atr = atr(atrLength)
tsl = f_getTrailingStop(atr, atrMult)

//U = plot(eUpper, title="Up", color=color.green, linewidth=2, style=plot.style_linebr)
//D = plot(exLower, title="Ex Low", color=color.red, linewidth=2, style=plot.style_linebr)
longCondition = crossover(close, eUpper[1]) and yearlyHighCondition and newHigh and maAlignmentLongCondition
exitLongCondition = crossunder(close, exLower[1])

shortCondition = crossunder(close, eLower[1]) and yearlyLowCondition and newLow
exitShortCondition = crossover(close, exUpper[1])
strategy.entry("Buy", strategy.long, when=longCondition and inDateRange, oca_name="oca_buy")
strategy.exit("ExitBuyDC", "Buy", when=exitStrategy=='dc', stop=exLower)
strategy.exit("ExitBuyTSL", "Buy", when=exitStrategy=='tsl', stop=tsl)
plot(strategy.position_size > 0 ? (exitStrategy=='dc'?exLower:tsl) : na, title="Trailing Stop", color=color.red, linewidth=2, style=plot.style_linebr)
//strategy.close("Buy", when=exitLongCondition)

Lebih lanjut