
A estratégia multifatorial combina três tipos diferentes de estratégias: estratégias de choque, estratégias de acompanhamento de tendências e estratégias de ruptura, para obter melhores efeitos estratégicos através da combinação de uso.
A estratégia multifatorial é modelada de acordo com:
A parte da estratégia de choque usa indicadores aleatórios para determinar o momento de compra e venda. Concretamente, um sinal de compra é gerado quando o indicador aleatório %K atravessa a linha %D da zona de superaquecimento e um sinal de venda é gerado quando a linha %K atravessa a linha %D da zona de superaquecimento.
A estratégia de tendência parte do uso de um cruzamento dourado da linha média SMA para determinar a direção da tendência. Quando a linha rápida atravessa a linha lenta de baixo, gera um sinal de compra. Quando a linha rápida atravessa a linha lenta de cima para baixo, gera um sinal de venda.
A parte da estratégia de ruptura monitora se o preço quebra o preço mais alto ou mais baixo no período especificado. Compra quando o preço supera o preço mais alto; venda quando o preço é inferior ao preço mais baixo.
Para avaliar a força da tendência em combinação com o indicador ADX, só é possível negociar com a tendência quando ela é forte o suficiente.
Estabeleça uma linha de stop loss e uma linha de stop loss, definindo uma proporção razoável de stop loss.
A estratégia multifatorial, que integra essas partes, segue principalmente a seguinte lógica:
Quando o ADX é maior do que o limiar definido, a tendência é considerada forte o suficiente para executar a estratégia de tendência; quando o ADX é menor do que o limiar, é considerado em equilíbrio e apenas executa a estratégia de choque.
Em uma situação de tendência, quando o SMA cruza a linha de câmbio rápido e lento, o ouro compra a posição aberta, e quando a forquilha morre, a posição baixa.
Em situações de turbulência, executa sinais de negociação de indicadores aleatórios.
As estratégias de ruptura são utilizadas em ambos os cenários de mercado para rastrear canais.
Configure o Stop Loss Stop Line para otimizar o lucro.
A maior vantagem da estratégia multifatorial é a combinação de diferentes tipos de estratégias, que podem obter melhores efeitos estratégicos em ambos os ambientes de mercado. Concretamente, a estratégia multifatorial tem as seguintes vantagens:
A capacidade de se adaptar a tendências e obter uma maior taxa de vitória em situações de tendências.
Os investidores devem ser capazes de lucrar em situações de turbulência e não ficarem presos em posições.
Com um fator de ganho mais alto, a configuração de stop-loss é razoável.
A partir daí, a tendência é de reduzir os prejuízos.
A combinação de vários indicadores pode formar um sinal de negociação mais forte.
A melhor combinação de parâmetros pode ser obtida através da otimização de parâmetros.
A estratégia multifactor também apresenta alguns riscos, incluindo:
A combinação inadequada de múltiplos fatores pode causar confusão nos sinais de negociação e requer testes repetidos para encontrar a combinação ideal de fatores.
Otimizar vários parâmetros é muito difícil e requer suporte de dados históricos suficientes.
Quando a tendência se inverte, a impossibilidade de fechar a posição a tempo pode levar a grandes perdas.
O indicador ADX está atrasado e pode ter perdido o ponto de viragem da tendência.
A ruptura de uma transação pode ser facilmente manipulada e requer uma estratégia de stop loss razoável.
Para os riscos acima mencionados, pode-se otimizar a partir dos seguintes pontos:
Teste a estabilidade de diferentes fatores nos dados históricos, selecionando o fator de estabilidade.
A busca de parâmetros ótimos através de métodos de otimização inteligente, como algoritmos genéticos.
Estabeleça um limite razoável de stop loss para controlar a retirada máxima.
A inversão da tendência, combinada com indicadores adicionais.
Optimizar a estratégia de parada de perdas para a ruptura de negócios, evitando grandes perdas.
A estratégia multifatorial também tem espaço para uma maior otimização:
Teste mais tipos de fatores para encontrar uma combinação melhor. Outros fatores podem ser considerados, como taxa de flutuação, volume de transação.
Buscar o melhor peso estratégico usando um método de aprendizagem de máquina.
A otimização de parâmetros pode ser feita por meio de algoritmos inteligentes que buscam otimização rápida.
Pode-se testar o rendimento em diferentes períodos de posse.
Considere-se a possibilidade de ajustar dinamicamente a linha de suspensão.
Pode-se introduzir mais condições de filtragem, como aumento de tráfego, para melhorar a qualidade do sinal.
Os indicadores ADX podem ser considerados como parâmetros de otimização ou substituídos por indicadores de tendência mais avançados.
A estratégia de múltiplos fatores compreende vários tipos de lógica de negociação, como tendências, tremores e rupturas, e pode obter melhores resultados em ambos os ambientes de mercado. Em comparação com a estratégia única, a estratégia de múltiplos fatores pode obter maiores ganhos estáveis e um bom espaço de escalabilidade.
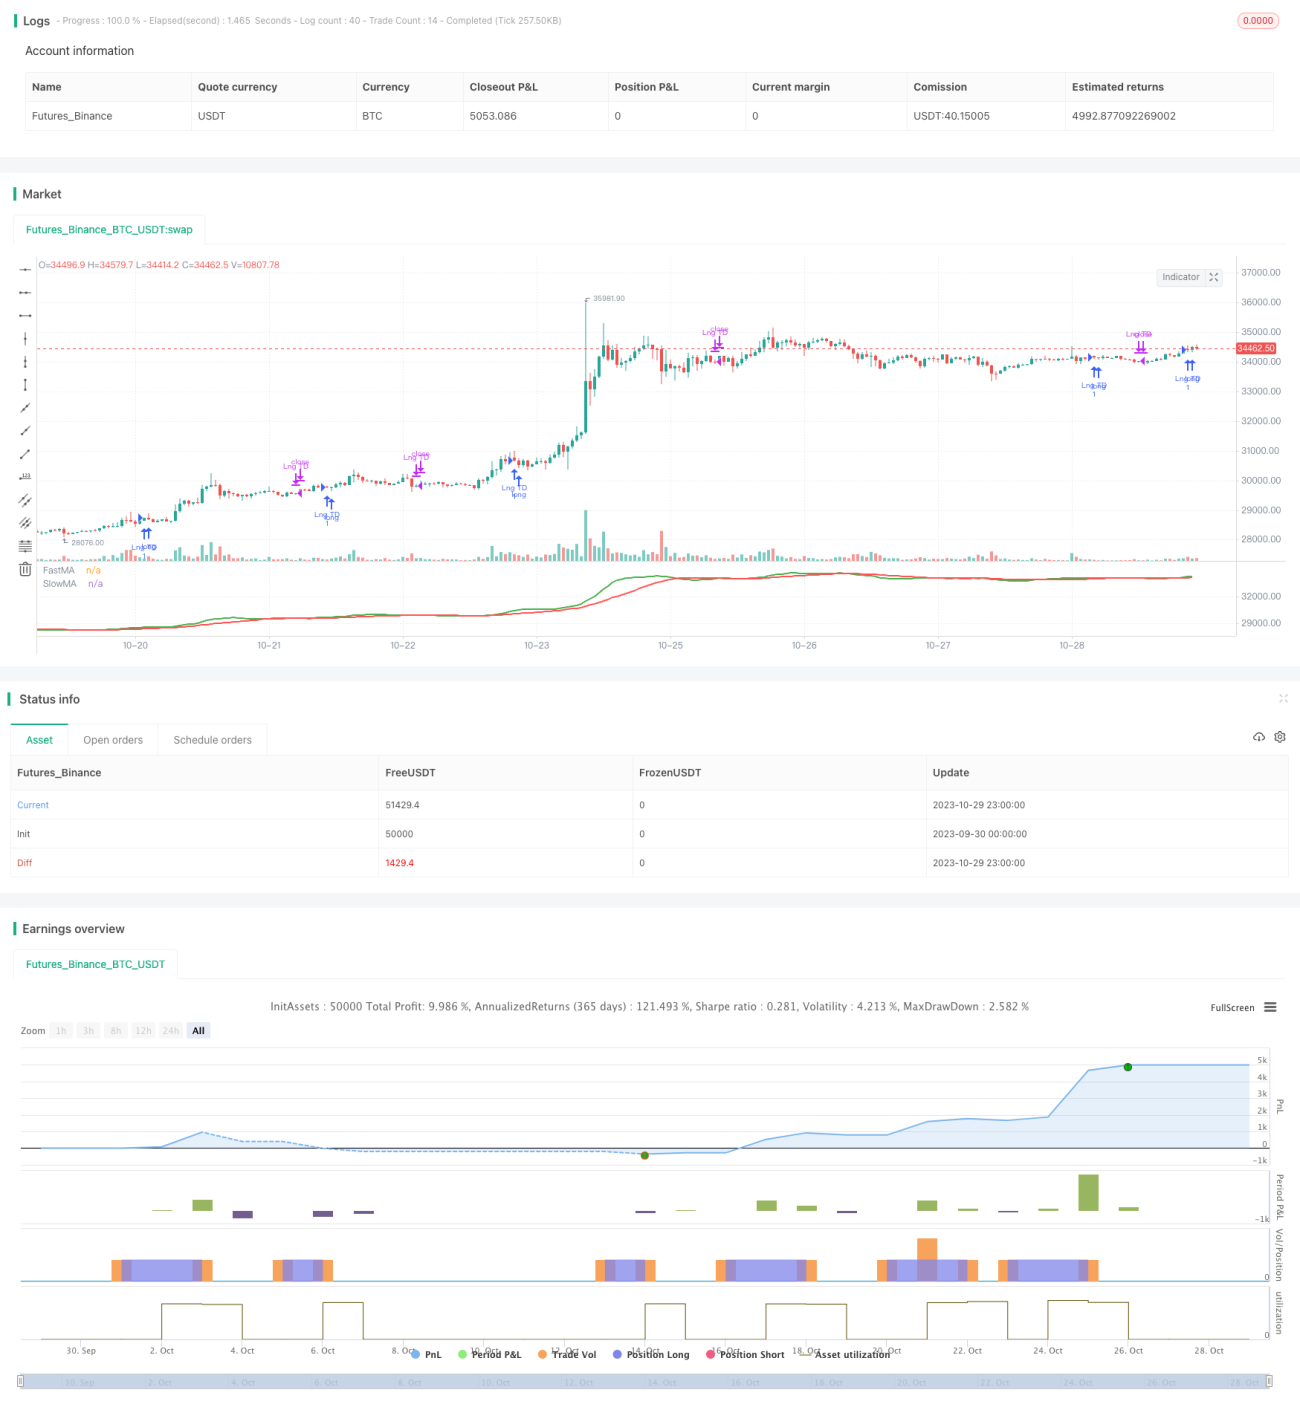
/*backtest
start: 2023-09-30 00:00:00
end: 2023-10-30 00:00:00
period: 1h
basePeriod: 15m
exchanges: [{"eid":"Futures_Binance","currency":"BTC_USDT"}]
*/
//@version=4
// strategy("Strategy_1", shorttitle="Strategy1",overlay=true ,pyramiding = 12, initial_capital=25000, currency='EUR', commission_type = strategy.commission.cash_per_order, commission_value = 3, default_qty_type = strategy.percent_of_equity, default_qty_value = 20)
// Revision: 1
// Author: Jonas
// === INPUT ===
// > BACKTEST RANGE <
FromMonth = input(defval=1, title="From Month", minval=1, maxval=12)
FromDay = input(defval=1, title="From Day", minval=1, maxval=31)
FromYear = input(defval=2017, title="From Year", minval=2010)
ToMonth = input(defval=1, title="To Month", minval=1, maxval=12)
ToDay = input(defval=1, title="To Day", minval=1, maxval=31)
ToYear = input(defval=9999, title="To Year", minval=2010)
// > STRATEGY SETTINGS <
bolOS = input(defval = false, type=input.bool, title="Oscillating Strategy")
bolTS = input(defval = true, type=input.bool, title="Trend Strategy")
bolBO = input(defval = false, type=input.bool, title="Breakout Strategy")
strStrategy = input(defval = "Long", type=input.string, title="Trade Strategy",options = ["Long", "Short","Long & Short"])
flStopLoss = input(defval = 2.0, title="Stop Loss %", type=input.float)/100
flTakeProfit = input(defval = 4.0, title="Take Profit %", type=input.float)/100
// > SMA <
fastMA = input(defval=8, type=input.integer, title="FastMA length", minval=1, step=1)
slowMA = input(defval=21, type=input.integer, title="SlowMA length", minval=1, step=1)
// > ADX <
adx_len = input(defval=10, type=input.integer, title="ADX length", minval=1, step=1)
adx_trend = input(defval=30, type=input.integer, title="ADX Tr", minval=1, step=1)
adx_choppy = adx_trend
adx_limit = adx_trend
// > TRENDSCORE <
ts_fromIndex = input(title="From", type=input.integer, minval=1, defval=10)
ts_toIndex = input(title="To", type=input.integer, minval=1, defval=14)
ts_src = input(title="Source", type=input.source, defval=close)
// > Oscillator <
stoch_length = 14
stoch_OverBought = 75
stoch_OverSold = 25
stoch_smoothK = 3
stoch_smoothD = 3
// === BACK TEST RANGE FUNCTION ===
window_start = timestamp(FromYear, FromMonth, FromDay, 00, 00) // backtest start window
window_finish = timestamp(ToYear, ToMonth, ToDay, 23, 59) // backtest finish window
window() => // create function "within window of time"
time >= window_start and time <= window_finish ? true : false
//plot(stop_level_Long, title="TEST",color=color.red, style=plot.style_linebr, linewidth=2)
//plot(take_level_Long, color=color.green, style=plot.style_linebr, linewidth=2)
// === ADX ===
adx_up = change(high)
adx_down = -change(low)
adx_trur = rma(tr, adx_len)
adx_plus = fixnan(100 * rma(adx_up > adx_down and adx_up > 0 ? adx_up : 0, adx_len) / adx_trur)
adx_minus = fixnan(100 * rma(adx_down > adx_up and adx_down > 0 ? adx_down : 0, adx_len) / adx_trur)
adx_sum = adx_plus + adx_minus
ADX = 100 * rma(abs(adx_plus - adx_minus) / (adx_sum == 0 ? 1 : adx_sum), adx_len)
//=== TRENDSCORE ===
trendscore(ts_src, ts_fromIndex, ts_toIndex) =>
ts_sum = 0.0
for i = ts_fromIndex to ts_toIndex
ts_sum := ts_sum + (ts_src >= nz(ts_src[i]) ? 1 : -1)
ts_sum
intTS = trendscore(ts_src, ts_fromIndex, ts_toIndex)
// Long if TrendDirection = 1, Short if TrendDirection = -1; Indifferent if TrendDirection = 0
intTrendDirection = (intTS > (ts_toIndex-ts_fromIndex)) ? 1 : (intTS < (ts_fromIndex-ts_toIndex)) ? -1 : 0
// > TREND CONDITION <
adx_growing = ADX > highest(ADX[1],3)
intTrend = ((ADX >= adx_limit) and (ADX[1] >= adx_limit) and adx_growing) ? intTrendDirection : 0
// === ATR ===
ATR = sma(tr,10)
ATR_100 = ATR /abs(high - low)
// === STOCHASTICS ===
stoch_k = sma(stoch(close, high, low, stoch_length), stoch_smoothK)
stoch_d = sma(stoch_k, stoch_smoothD)
// === FILTER & CONDITIONS ===
// > STOCHASTICS <
bolFilter_OS1 = close[1] > hl2[1]
bolSigOsc_long_1 = (na(stoch_k) or na(stoch_d)) ? false : (crossover(stoch_d,stoch_OverSold) and stoch_k > stoch_d) ? true:false
bolSigOsc_short_1 = (na(stoch_k) or na(stoch_d)) ? false : (crossunder(stoch_d,stoch_OverBought) and stoch_k < stoch_d) ? true:false
bolLongOpenOS = bolSigOsc_long_1 and bolFilter_OS1
bolLongCloseOS = bolSigOsc_short_1
bolShortOpenOS = bolSigOsc_short_1 and bolFilter_OS1
bolShortCloseOS = bolSigOsc_long_1
// > TREND <
bolFilter_TS1 = close[1] > hl2[1] and open[1] < hl2[1]
bolFilter_TS2 = sma(close,50)>sma(close,50)[10]
bolFilter_TS3 = close[1] < hl2[1] and open[1] > hl2[1]
bolSigTrendLO1 = sma(close, fastMA) > sma(close, slowMA)
bolSigTrendLO2 = close > sma(close,fastMA)
bolSigTrendLO3 = bolSigTrendLO1 and bolSigTrendLO2
bolSigTrendLC1 = sma(close, fastMA) < sma(close, slowMA)
bolSigTrendLC2 = close < sma(close, fastMA)
bolSigTrendLC3 = bolSigTrendLC1 and bolSigTrendLC2
bolSigTrendSO1 = bolSigTrendLC3
bolSigTrendSC1 = bolSigTrendLO1
bolLongOpenTS = bolSigTrendLO3 and bolFilter_TS1
bolLongCloseTS = bolSigTrendLC3 and bolFilter_TS3
bolShortOpenTS = bolSigTrendSO1 and bolFilter_TS3
bolShortCloseTS = bolLongOpenTS and bolFilter_TS1
plot(sma(close, fastMA), title='FastMA', color=color.green, linewidth=2, style=plot.style_line) // plot FastMA
plot(sma(close, slowMA), title='SlowMA', color=color.red, linewidth=2, style=plot.style_line) // plot SlowMA
// > BREAKOUT <
flFilter_BS1 = 0.5 * stdev(close,slowMA)[1]
bolFilter_BS2 = volume > sma(volume,slowMA)*1.25
bolSigBreakoutLO1 = close > (highestbars(high,slowMA)[1] + flFilter_BS1)
bolSigBreakoutLC1 = barssince(bolSigBreakoutLO1)==5
bolSigBreakoutSO1 = close < lowestbars(low,slowMA)[1] - flFilter_BS1
bolSigBreakoutSC1 = barssince(bolSigBreakoutSO1)==5
bolLongOpenBO = bolSigBreakoutLO1 and bolFilter_BS2
bolLongCloseBO = bolSigBreakoutLC1
bolShortOpenBO = bolSigBreakoutSO1 and bolFilter_BS2
bolShortCloseBO = bolSigBreakoutSC1
//=== STRATEGIES ENTRIES & EXITS ===
// > STOPS & LIMITS <
stop_level_Long = strategy.position_avg_price * (1 - flStopLoss)
take_level_Long = strategy.position_avg_price * (1 + flTakeProfit)
stop_level_Short = strategy.position_avg_price * (1 + flStopLoss)
take_level_Short = strategy.position_avg_price * (1 - flTakeProfit)
// > ENTRIES / CLOSES / EXITS <
if window() //only in backtest-window
if (bolOS == true)
if (intTrend == 0)
if(strStrategy == "Long" or strStrategy == "Long & Short")
strategy.entry("Lng Osc", strategy.long, when=bolLongOpenOS) // buy long when "within window of time" AND crossover
if(strStrategy == "Short" or strStrategy == "Long & Short")
strategy.entry("Short Osc", strategy.short, when=bolShortOpenOS)
strategy.close("Lng Osc", when=(bolLongCloseOS))
//strategy.exit("Exit L OS/STD", "Lng Osc", stop = strategy.position_avg_price - 2*stdev(close,10))
strategy.exit("Exit L OS/%", "Lng Osc", stop=stop_level_Long)
strategy.close("Short Osc", when=(bolShortCloseOS))
//strategy.exit("Exit S OS/STD", "Short Osc", stop = strategy.position_avg_price + 2*stdev(strategy.position_avg_price,10))
strategy.exit("Exit S OS/%", "Short Osc", stop=stop_level_Short)
if (bolTS == true)
if (not(intTrend == 0))
if((strStrategy == "Long") or (strStrategy == "Long & Short"))
strategy.entry("Lng TD", strategy.long, when=bolLongOpenTS) // buy long when "within window of time" AND crossover
if((strStrategy == "Short") or (strStrategy == "Long & Short"))
strategy.entry("Short TD", strategy.short, when=(bolShortOpenTS and bolTS)) // buy long when "within window of time" AND crossover
strategy.exit("Exit L TD", "Lng TD", stop=stop_level_Long)
strategy.close("Lng TD", when=bolLongCloseTS)
strategy.exit("Exit S TD", "Short TD", stop=stop_level_Short)
strategy.close("Short TD", when=bolShortCloseTS)
if (bolBO == true)
if((strStrategy == "Long") or (strStrategy == "Long & Short"))
strategy.entry("Lng BO", strategy.long, when=bolLongOpenBO) // buy long when "within window of time" AND crossover
strategy.close("Lng BO", when=bolLongCloseBO)
//strategy.exit("Exit L BO/STD", "Lng BO", stop = strategy.position_avg_price - 2*stdev(strategy.position_avg_price,10))
strategy.exit("Exit L BO/2.5%", "Lng BO", stop=stop_level_Long)
if((strStrategy == "Short") or (strStrategy == "Long & Short"))
strategy.entry("Short BO", strategy.short, when=bolShortOpenBO) // buy long when "within window of time" AND crossover
strategy.close("Short BO", when=bolShortCloseBO)
//strategy.exit("Exit S BO/STD", "Short BO", stop = strategy.position_avg_price - 2*stdev(strategy.position_avg_price,10))
strategy.exit("Exit S BO/%", "Short BO", stop=stop_level_Short)