Estratégia de cruzamento de seta de média móvel dupla

Visão geral
A estratégia determina o momento de comprar e vender através do cálculo da dupla equilíbrio entre os MACDs. A estratégia traça uma forma de flecha no gráfico para indicar um sinal de negociação.
Princípios
A estratégia primeiro calcula a linha rápida (EMA 12), a linha lenta (EMA 26) e a diferença do MACD. Em seguida, os momentos de compra e venda são julgados com base nos forcados de ouro da linha rápida e da linha lenta e no diferencial MACD positivo e negativo:
- Quando a linha rápida atravessa a linha lenta ((Goldfork) e o diferencial MACD atravessa 0 é um sinal de compra
- Quando a linha rápida atravessa a linha lenta (dead fork) e a diferença MACD passa por 0 é um sinal de venda
Para filtrar falsos sinais, o código também julga o estado do sinal da linha K anterior. O sinal atual só é acionado quando a linha K atual é um sinal inverso (compra para venda ou venda para compra).
Além disso, o código também traça um gráfico de setas para indicar quando comprar e vender na linha K.
Vantagens
A estratégia tem as seguintes vantagens:
- O uso de um julgamento de cruzamento de duas equações permite filtrar eficazmente o ruído do mercado e identificar tendências
- Combinação com a avaliação de diferença do MACD para evitar omissões e erros de avaliação
- O uso de setas para indicar a hora de comprar e vender é mais claro.
- Regras simples, claras, fáceis de entender e copiar
Riscos e soluções
A estratégia também apresenta alguns riscos:
- O cruzamento de duas medianas é propenso a produzir falsos sinais, o que pode levar a excesso de negociação. Pode-se ajustar adequadamente os parâmetros de mediana ou adicionar outras condições de filtragem para reduzir os falsos sinais.
- Não é possível avaliar oscilações na tendência, podendo ocorrer prejuízos. Indicadores de tendência como o ADX podem ser usados para evitar isso.
- Condições fixas de compra e venda tornam as estratégias mais mecânicas, não conseguem se adaptar às mudanças do mercado. Pode-se tentar métodos de adaptação como aprendizado de máquina para otimizar
Direção de otimização
A estratégia pode ser otimizada em várias direções:
- Teste diferentes combinações de parâmetros para encontrar a melhor linha rápida, lenta e MACD
- Aumentar os requisitos de entrada, como o volume de transações para filtrar os sinais
- Aumentar o mecanismo de suspensão de prejuízos para controlar as perdas individuais
- Indicadores de volatilidade como o VIX são usados para avaliar a preferência de risco
- Experimentar com modelos de aprendizagem de máquina em vez de regras fixas para a otimização da adaptação das estratégias
Resumir
A estratégia de crossover binário é bastante simples e prática em geral. Com o julgamento de crossover binário e a filtragem de diferença MACD, é possível identificar pontos de compra e venda em tendências de linha média e longa, evitando a mudança de preço perdida. Os avisos de seta também tornam a operação mais clara e clara.
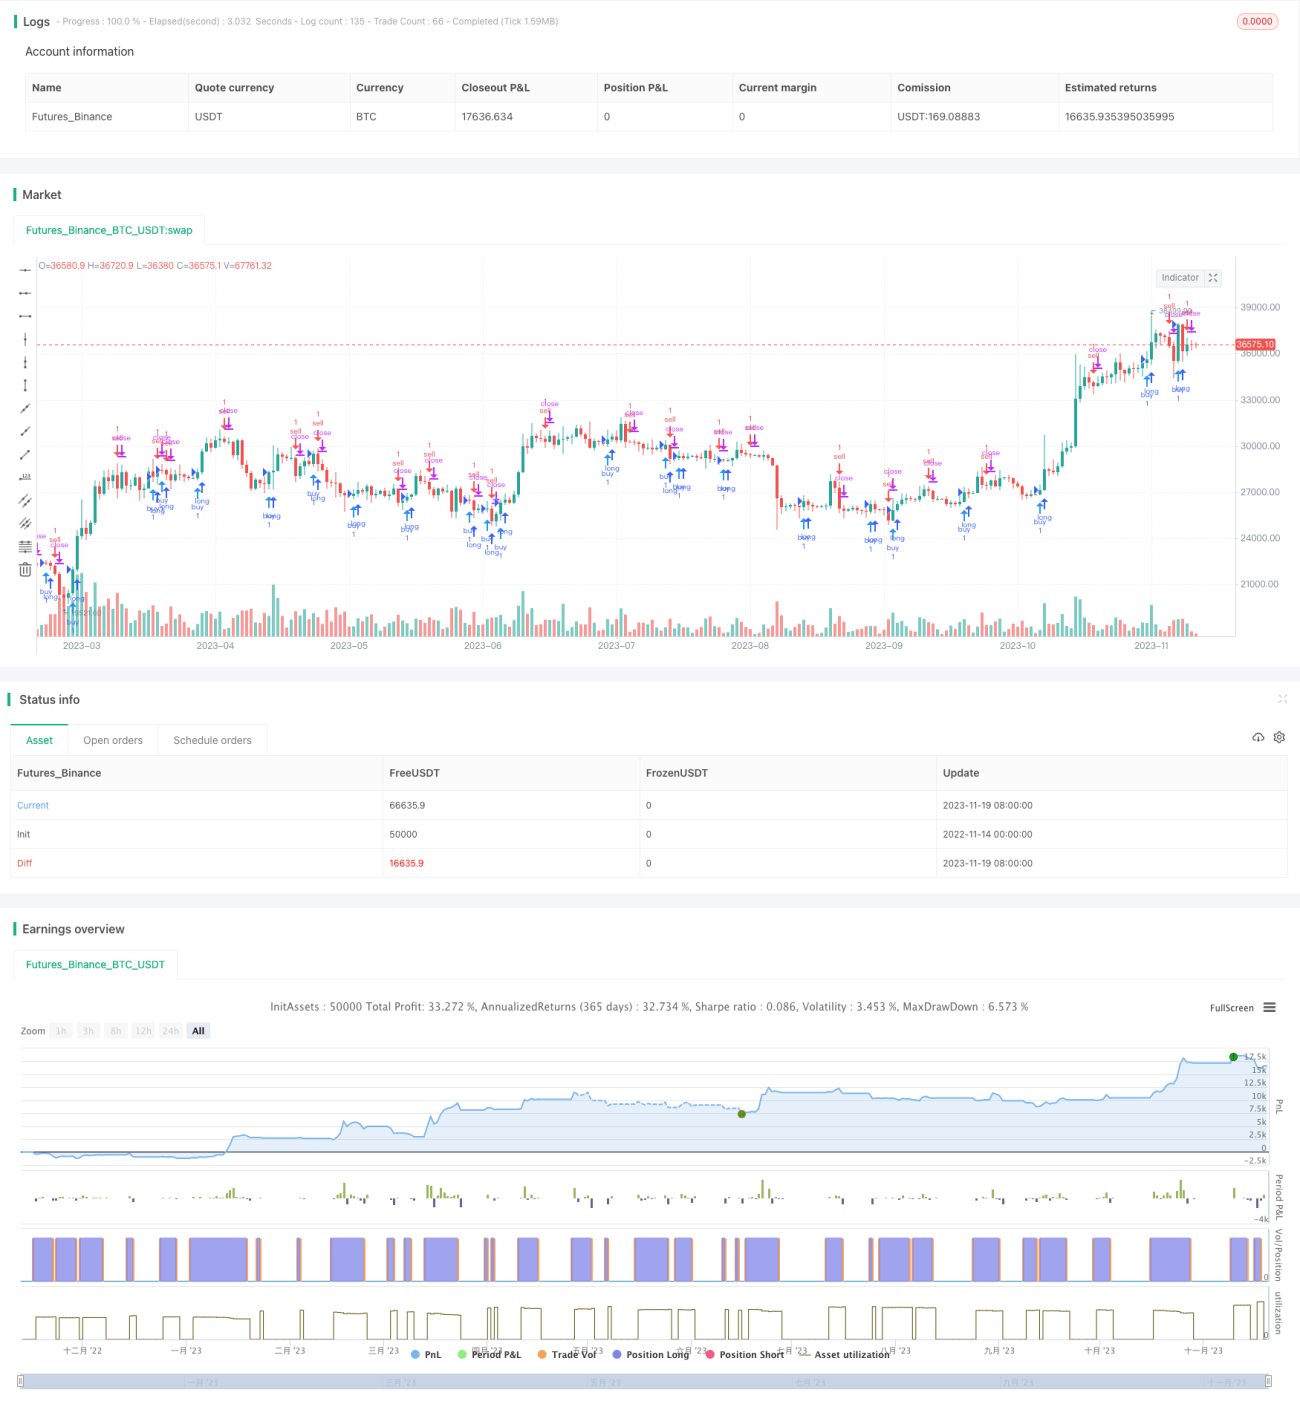
/*backtest
start: 2022-11-14 00:00:00
end: 2023-11-20 00:00:00
period: 1d
basePeriod: 1h
exchanges: [{"eid":"Futures_Binance","currency":"BTC_USDT"}]
*/

//@version=3
//Daniels stolen code
strategy(shorttitle="Daniels Stolen Code", title="Daniels Stolen Code", overlay=true, calc_on_order_fills=true, pyramiding=0)
- 1