Estratégia de salto de média móvel


Data de criação: 2023-12-08 16:47:39 última modificação: 2023-12-08 16:47:39
cópia: 0 Cliques: 925
1
focar em
1621
Seguidores

Estratégia de salto de média móvel

Visão geral da estratégia

A estratégia de rebote de média móvel é uma estratégia que segue o preço quebrando a média móvel. Ela verifica se o craque rebote abaixo da média móvel, e se o for, é um sinal de múltiplos pontos; se o craque rebote na direção abaixo da média móvel, é um sinal de cabeça vazia.

Nome da política

Exponential Moving Average Bounce Strategy

Princípio da estratégia

A estratégia é baseada em uma média móvel exponencial. Ela calcula uma linha EMA em tempo real. Em seguida, verifica se o preço rebota acima ou abaixo da linha EMA:

  • Se o preço derrubar a linha EMA e depois voltar a subir acima da linha EMA, é um sinal de multiplicação
  • Se o preço ultrapassar a linha EMA e voltar a cair para fechar abaixo da linha EMA, é um sinal de cabeça-vazia

A reação é o sinal de entrada para a estratégia.

Análise de vantagens estratégicas

“Operação de fluxo, evita armadilhas”

A estratégia de rebote da EMA só entra em ação após a determinação de uma reversão de preço, evitando que a operação de reversão seja bloqueada.

Pequenas retrações, bons rendimentos históricos

O uso de médias móveis indexadas, que são capazes de suavizar os dados de preços e filtrar o ruído do mercado, faz com que a estratégia tenha um retorno menor e melhores resultados históricos.

É fácil de entender, com flexibilidade de ajuste de parâmetros

A estratégia de rebote da EMA depende apenas da média móvel, é muito simples e direta, fácil de entender para os novatos; ao mesmo tempo, os parâmetros do ciclo da EMA podem ser ajustados de forma flexível para adaptar-se a diferentes variedades.

Análise de Riscos

Falsos sinais

Frequentemente, existem falsas rupturas densas perto da linha EMA, que podem desencadear sinais errados. Os parâmetros EMA precisam ser ajustados para filtrar esses ruídos.

A operação está em andamento e não há previsão do ponto de viragem.

Essa estratégia é essencialmente uma operação de tendência. Não há como prever os pontos de inflexão dos preços, apenas para perseguir a tendência.

A posição de parada é facilmente atingida.

Os pontos de parada perto das médias móveis são às vezes ultrapassados, o que aumenta os prejuízos. Isso requer um método de parada mais flexível.

Direção de otimização

Combinação com outros indicadores de filtragem

Outros indicadores, como o RSI, MACD e outros, podem ser adicionados para confirmar a inversão de preços e filtrar os falsos sinais.

Optimizar o modo de deter perdas

Pode-se usar um modo de parada mais flexível, como o tempo de parada e o pára-choque, para reduzir o risco de ser atingido.

Optimização de parâmetros

Otimizar os parâmetros do ciclo EMA para encontrar a melhor combinação de parâmetros. Também é possível fazer com que os parâmetros do EMA mudem dinamicamente para acompanhar o ciclo do mercado.

Resumir

A estratégia de rebote de média móvel é uma estratégia de acompanhamento de tendências simples e práticas. Ela é progressiva, com pequenas retrações e fácil de entender. Ao mesmo tempo, existe um certo risco de falso sinal e risco de parada. Podemos otimizar a estratégia com uma melhor combinação de indicadores, métodos de parada e escolha de parâmetros, tornando-a uma estratégia de quantificação estável e confiável.
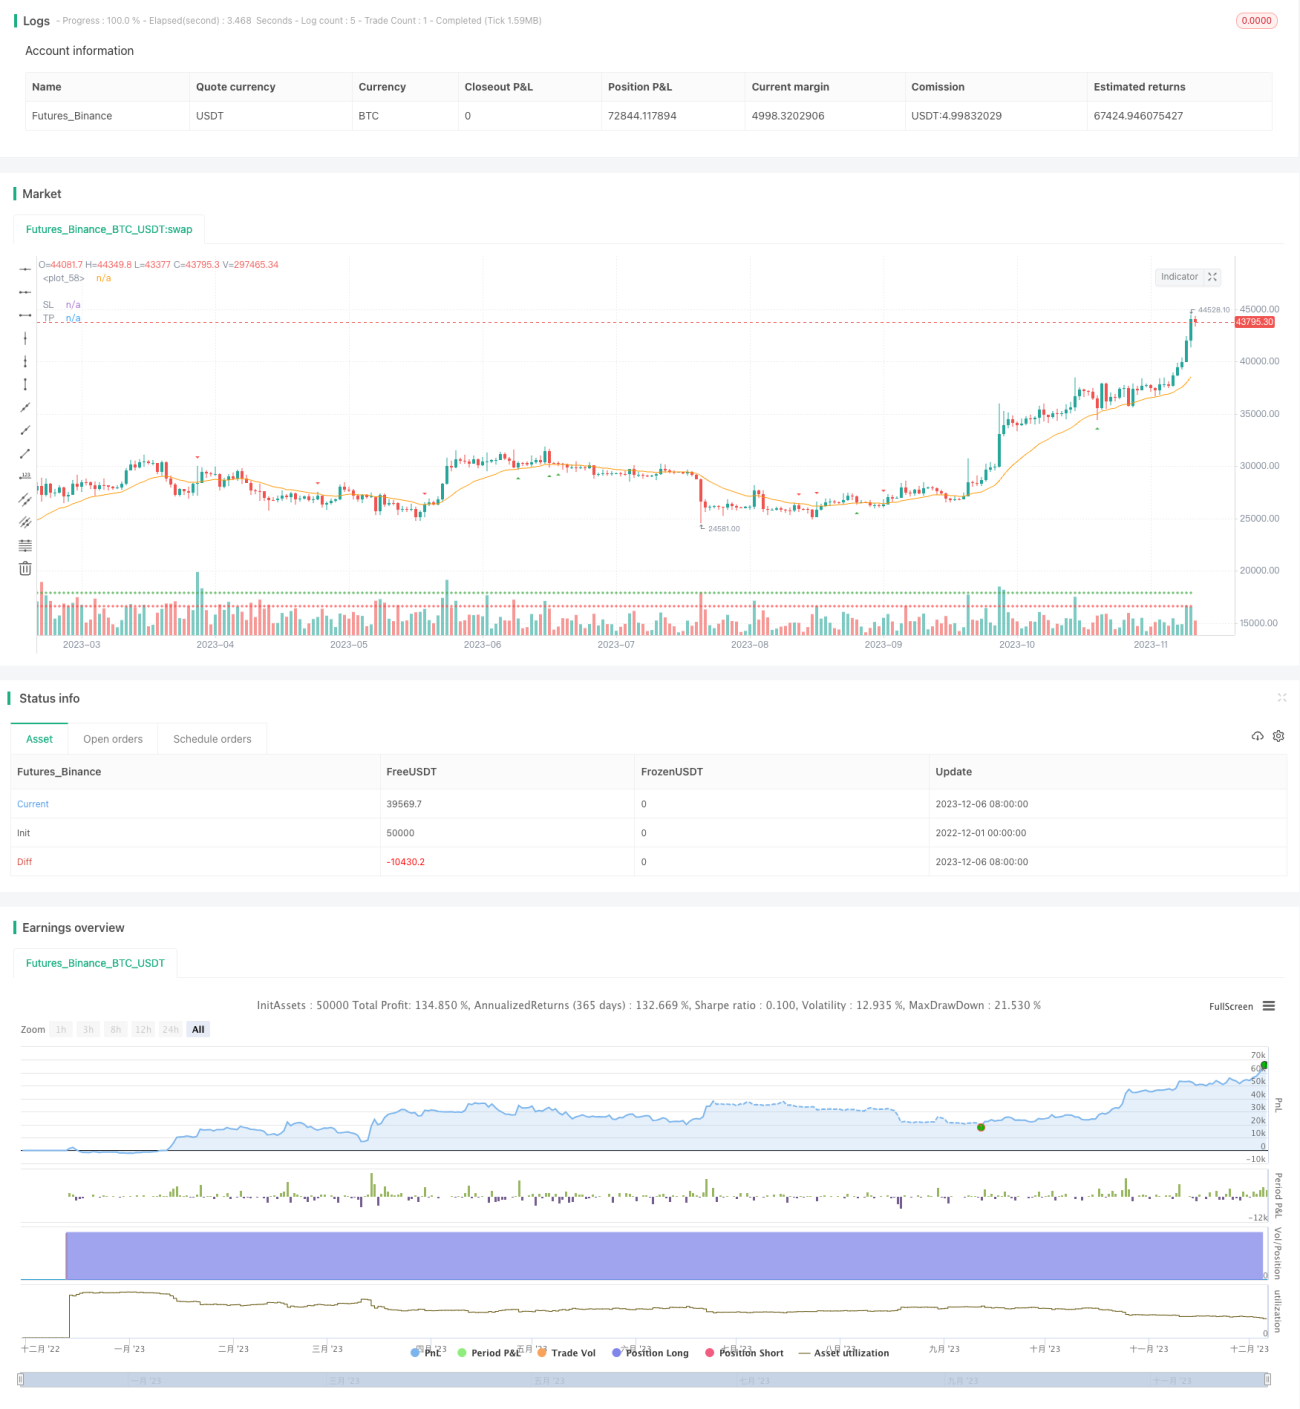
Código-fonte da estratégia
/*backtest
start: 2022-12-01 00:00:00
end: 2023-12-07 00:00:00
period: 1d
basePeriod: 1h
exchanges: [{"eid":"Futures_Binance","currency":"BTC_USDT"}]
*/

// This source code is subject to the terms of the Mozilla Public License 2.0 at https://mozilla.org/MPL/2.0/
// © tweakerID

// Simple strategy that checks for price bounces over an Exponential Moving Average. If the CLOSE of the candle bounces
// back from having it's LOW below the EMA, then it's a Bull Bounce. If the CLOSE of the candle bounces down from having it's
// high above the EMA, then it's a Bear Bounce. This logic can be reverted.

//@version=4
strategy("EMA Bounce", overlay=true, 
     default_qty_type=strategy.percent_of_equity, 
     default_qty_value=100, 
     initial_capital=10000, 
     commission_value=0.04, 
     calc_on_every_tick=false, 
     slippage=0)

direction = input(0, title = "Strategy Direction", type=input.integer, minval=-1, maxval=1)
strategy.risk.allow_entry_in(direction == 0 ? strategy.direction.all : (direction < 0 ? strategy.direction.short : strategy.direction.long))

/////////////////////// STRATEGY INPUTS ////////////////////////////////////////
title1=input(true, "-----------------Strategy Inputs-------------------")  

i_EMA=input(20, title="EMA Length")

/////////////////////// BACKTESTER /////////////////////////////////////////////
title2=input(true, "-----------------General Inputs-------------------")  

// Backtester General Inputs
i_SL=input(true, title="Use Swing Stop Loss and Take Profit")
i_SPL=input(defval=10, title="Swing Point Loopback")
i_PercIncrement=input(defval=.2, step=.1, title="Swing Point SL Perc Increment")*0.01
i_TPRRR = input(1.2, step=.1, title="Take Profit Risk Reward Ratio")

// Bought and Sold Boolean Signal
bought = strategy.position_size > strategy.position_size[1] 
 or strategy.position_size < strategy.position_size[1]

// Price Action Stop and Take Profit
LL=(lowest(i_SPL))*(1-i_PercIncrement)
HH=(highest(i_SPL))*(1+i_PercIncrement)
LL_price = valuewhen(bought, LL, 0)
HH_price = valuewhen(bought, HH, 0)
entry_LL_price = strategy.position_size > 0 ? LL_price : na 
entry_HH_price = strategy.position_size < 0 ? HH_price : na 
tp=strategy.position_avg_price + (strategy.position_avg_price - entry_LL_price)*i_TPRRR
stp=strategy.position_avg_price - (entry_HH_price - strategy.position_avg_price)*i_TPRRR


/////////////////////// STRATEGY LOGIC /////////////////////////////////////////

EMA=ema(close, i_EMA)
LowAboveEMA=low > EMA
LowBelowEMA=low < EMA
HighAboveEMA=high > EMA
HighBelowEMA=high < EMA
BullBounce=LowAboveEMA[1] and LowBelowEMA and close > EMA //and close > open
BearBounce=HighBelowEMA[1] and HighAboveEMA and close < EMA //and close < open
plot(EMA)

BUY=BullBounce
SELL=BearBounce

//Inputs
DPR=input(false, "Allow Direct Position Reverse")
reverse=input(false, "Reverse Trades")

// Entries
if reverse
    if not DPR
        strategy.entry("long", strategy.long, when=SELL and strategy.position_size == 0)
        strategy.entry("short", strategy.short, when=BUY and strategy.position_size == 0)
    else     
        strategy.entry("long", strategy.long, when=SELL)
        strategy.entry("short", strategy.short, when=BUY)
else
    if not DPR 
        strategy.entry("long", strategy.long, when=BUY and strategy.position_size == 0)
        strategy.entry("short", strategy.short, when=SELL and strategy.position_size == 0)
    else
        strategy.entry("long", strategy.long, when=BUY)
        strategy.entry("short", strategy.short, when=SELL)


SL=entry_LL_price
SSL=entry_HH_price
TP=tp
STP=stp

strategy.exit("TP & SL", "long", limit=TP, stop=SL, when=i_SL)
strategy.exit("TP & SL", "short", limit=STP, stop=SSL, when=i_SL)

/////////////////////// PLOTS //////////////////////////////////////////////////

plot(strategy.position_size > 0 ? SL : na , title='SL', style=plot.style_cross, color=color.red)
plot(strategy.position_size < 0 ? SSL : na , title='SSL', style=plot.style_cross, color=color.red)
plot(strategy.position_size > 0 ? TP : na, title='TP', style=plot.style_cross, color=color.green)
plot(strategy.position_size < 0 ? STP : na, title='STP', style=plot.style_cross, color=color.green)
// Draw price action setup arrows
plotshape(BUY ? 1 : na, style=shape.triangleup, location=location.belowbar, 
 color=color.green, title="Bullish Setup", transp=80, size=size.auto)
plotshape(SELL ? 1 : na, style=shape.triangledown, location=location.abovebar, 
 color=color.red, title="Bearish Setup", transp=80, size=size.auto)