Estratégia de rastreamento de tendências dinâmicas


Data de criação: 2023-12-11 15:43:42 última modificação: 2023-12-11 15:43:42
cópia: 3 Cliques: 731
1
focar em
1621
Seguidores

Estratégia de rastreamento de tendências dinâmicas

Visão geral

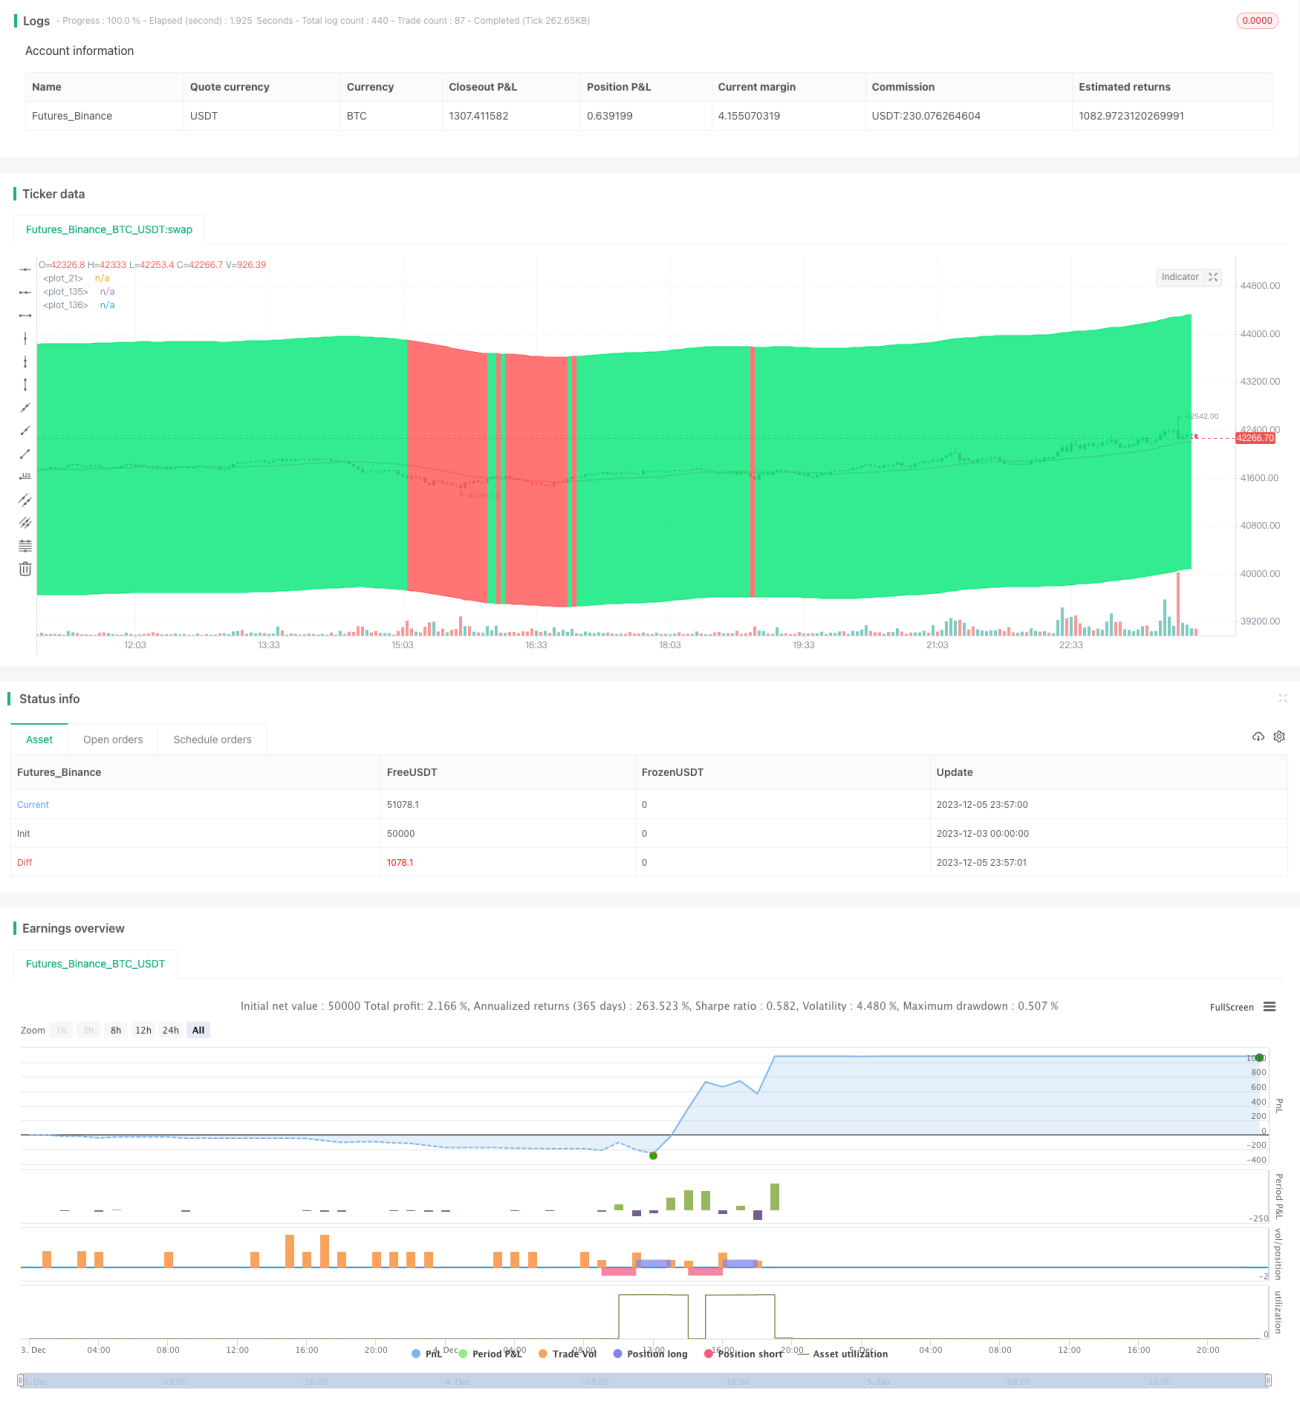
A ideia principal desta estratégia é acompanhar dinamicamente a tendência do mercado, comprando quando a tendência é alta e vendendo quando a tendência é baixa. Ela determina a direção da tendência através da computação de uma combinação de vários indicadores, como a regressão linear, a média móvel modificada de Hull, etc.

Princípio da estratégia

Esta estratégia usa vários indicadores técnicos para determinar a direção da tendência. Primeiro, ela calcula um canal de alcance, cujo limite superior e inferior é calculado com base na média móvel simples de close e em um parâmetro de entrada. Em seguida, ela calcula a média móvel de Hull modificada, que é considerada uma representação mais precisa da tendência. Além disso, calcula o indicador de regressão linear.

A fim de reduzir os sinais errados, a estratégia também projetou vários filtros. Por exemplo, o uso de EMA para determinar se está em uma tendência de queda, e o uso de um indicador de janela para avaliar a mudança no RSI. Estes filtros podem evitar a produção de sinais de negociação em situações de turbulência.

Em termos de entrada e parada, a estratégia registra o último preço de abertura da posição e define a porcentagem de stop loss. Por exemplo, se o preço de abertura da última posição é de US \( 100, define um objetivo de stop loss de US \) 102 e o preço de parada de US $ 95. Isso permite o acompanhamento dinâmico.

Análise de vantagens

A estratégia tem as seguintes vantagens:

  1. O Google Analytics é uma ferramenta de análise de tendências, que permite a captação de tendências em linhas mais longas.
  2. O uso de filtros múltiplos reduz o ruído e evita transações frequentes em situações de turbulência;
  3. Ajustar automaticamente a posição do stop loss para acompanhar a tendência;
  4. Pode-se encontrar automaticamente a melhor combinação de parâmetros através de otimização de parâmetros.

Análise de Riscos

A estratégia também apresenta alguns riscos:

  1. O risco de ser manipulado ainda não é totalmente evitável. Quando a tendência se inverter, pode haver grandes perdas.
  2. A configuração inadequada de parâmetros pode levar a um mau desempenho da estratégia. É necessário encontrar a melhor combinação de parâmetros através da otimização.
  3. O tempo de processamento de dados pode causar atraso no sinal. O cálculo do indicador deve ser otimizado para que seja o mais real possível.

Para controlar o risco, você pode definir um stop loss, trail stop ou usar opções para bloquear os lucros. Além disso, é necessário testar repetidamente o conjunto de parâmetros para encontrar um intervalo de parâmetros confiável. Finalmente, também é necessário prestar atenção ao tempo de cálculo do indicador e procurar a atualidade do sinal.

Direção de otimização

A estratégia pode ser melhorada em vários aspectos:

  1. Teste mais combinações de indicadores para encontrar maneiras mais confiáveis de avaliar tendências;
  2. Ajustar o intervalo de parâmetros para encontrar os melhores;
  3. Otimizar os filtros de sinal para encontrar um equilíbrio entre o desnível de ruído e o atraso;
  4. Tente criar regras de negociação automáticas através de métodos como o aprendizado de máquina.

No processo de otimização, deve-se aproveitar ao máximo o feedback e a simulação de transações para avaliar a qualidade do sinal e a estabilidade da estratégia. Somente soluções de otimização totalmente validadas podem ser aplicadas no mercado real.

Resumir

Esta estratégia é, em geral, uma boa estratégia de acompanhamento de tendências. Ela usa vários indicadores para avaliar as tendências, configura filtros para reduzir sinais errados e pode ajustar automaticamente o rastreamento de tendências de stop loss. Se os parâmetros forem configurados corretamente, ela pode capturar as tendências de linha média e longa com sucesso.

Código-fonte da estratégia
/*backtest
start: 2023-12-03 00:00:00
end: 2023-12-06 00:00:00
period: 3m
basePeriod: 1m
exchanges: [{"eid":"Futures_Binance","currency":"BTC_USDT"}]
*/

// This source code is subject to the terms of the Mozilla Public License 2.0 at https://mozilla.org/MPL/2.0/
// © RafaelZioni

//@version=4
strategy(title = " BTC 15 min", overlay = true, pyramiding=1,initial_capital = 10000, default_qty_type= strategy.percent_of_equity, default_qty_value = 20, calc_on_order_fills=false, slippage=0,commission_type=strategy.commission.percent,commission_value=0.075)
strat_dir_input = input(title="Strategy Direction", defval="all", options=["long", "short", "all"])
strat_dir_value = strat_dir_input == "long" ? strategy.direction.long : strat_dir_input == "short" ? strategy.direction.short : strategy.direction.all
strategy.risk.allow_entry_in(strat_dir_value)
price = close
length8 = input(30,title = 'length of channel')
upmult = input(title = 'upper percent',type=input.float, step=0.1, defval=5)
lowmult = input(title = 'lower percent',type=input.float, step=0.1, defval=5)

basis = sma(close, length8)

vup = upmult * price / 100
vlow = lowmult * price / 100

upper = basis + vup
lower = basis - vlow
plot(basis, color=color.red)


//
fastLength = input(3, title="Fast filter length ", minval=1)
slowLength = input(21,title="Slow filter length",  minval=1)
source=close
v1=ema(source,fastLength)
v2=ema(source,slowLength)
//

leng=1
p1=close[1]

len55 = 10
//taken from https://www.tradingview.com/script/Ql1FjjfX-security-free-MTF-example-JD/
HTF = input("1D", type=input.resolution)
ti = change( time(HTF) ) != 0
T_c = fixnan( ti ? close : na )

vrsi = rsi(cum(change(T_c) * volume), leng)
pp=wma(vrsi,len55)

d=(vrsi[1]-pp[1])
len100 = 10
x=ema(d,len100)
//
zx=x/-1
col=zx > 0? color.lime : color.orange

//

tf10 = input("1", title = "Timeframe", type = input.resolution, options = ["1", "5", "15", "30", "60","120", "240","360","720", "D", "W"])

length = input(50, title = "Period", type = input.integer)
shift = input(1, title = "Shift", type = input.integer)

hma(_src, _length)=>
    wma((2 * wma(_src, _length / 2)) - wma(_src, _length), round(sqrt(_length)))
    
hma3(_src, _length)=>
    p = length/2
    wma(wma(close,p/3)*3 - wma(close,p/2) - wma(close,p),p)

b =security(syminfo.tickerid, tf10, hma3(close[1], length)[shift])
//plot(a,color=color.gray)
//plot(b,color=color.yellow)
close_price = close[0]
len = input(25)

linear_reg = linreg(close_price, len, 0)


buy=crossover(linear_reg, b) 
sell=crossunder(linear_reg, b) or crossunder(close[1],upper)
//

src2=low
src3=high
Min =input(15)
leni = timeframe.isintraday and timeframe.multiplier >= 1 ? 
   Min / timeframe.multiplier * 7 : 
   timeframe.isintraday and timeframe.multiplier < 60 ? 
   60 / timeframe.multiplier * 24 * 7 : 7

l1 = wma(src2,leni)
h1 = wma(src3,leni)
//
m=(h1+l1)/2
//
len5 = 100

src5=m

//
multi = 2

mean = ema(src5, len5)  
stddev = multi * stdev(src5, len5)  
b5 = mean + stddev
s5 = mean - stddev


var bool long = na
var bool short = na

long :=crossover(src5, s5) 
short :=  crossunder(src5, b5)

var float last_open_long = na
var float last_open_short = na

last_open_long := long ? close : nz(last_open_long[1])
last_open_short := short ? close : nz(last_open_short[1])


entry_value =last_open_long
entry_value1=last_open_short

r=100
//
highb = highest(entry_value1, r)  
lowb = lowest(entry_value, r)  
d5 = highb - lowb  
me = (highb + lowb) / 2  
h4 = highb - d5 * 0.236  
c3 = highb - d5 * 0.382  
c4 = highb - d5 * 0.618  
l4 = highb - d5 * 0.764  
//
col2 = close >= me ? color.lime : color.red
       
p5 = plot(upper, color=col2)
p2 = plot(lower, color=col2)
fill(p5, p2,color=col2)
// Conditions

longCond = bool(na)
shortCond = bool(na)
longCond := crossover(zx,0) or buy 
shortCond := sell

// Count your long short conditions for more control with Pyramiding

sectionLongs = 0
sectionLongs := nz(sectionLongs[1])
sectionShorts = 0
sectionShorts := nz(sectionShorts[1])

if longCond
    sectionLongs := sectionLongs + 1
    sectionShorts := 0
    sectionShorts

if shortCond
    sectionLongs := 0
    sectionShorts := sectionShorts + 1
    sectionShorts

// Pyramiding

pyrl = 1


// These check to see your signal and cross references it against the pyramiding settings above

longCondition = longCond and sectionLongs <= pyrl
shortCondition = shortCond and sectionShorts <= pyrl

// Get the price of the last opened long or short

last_open_longCondition = float(na)
last_open_shortCondition = float(na)
last_open_longCondition := longCondition ? open : nz(last_open_longCondition[1])
last_open_shortCondition := shortCondition ? open : nz(last_open_shortCondition[1])

// Check if your last postion was a long or a short

last_longCondition = float(na)
last_shortCondition = float(na)
last_longCondition := longCondition ? time : nz(last_longCondition[1])
last_shortCondition := shortCondition ? time : nz(last_shortCondition[1])

in_longCondition = last_longCondition > last_shortCondition
in_shortCondition = last_shortCondition > last_longCondition

// Take profit

isTPl = true
//isTPs = input(false, "Take Profit Short")
tp = input(2, "Exit Profit %", type=input.float)
long_tp = isTPl and crossover(high, (1 + tp / 100) * last_open_longCondition) and longCondition == 0 and in_longCondition == 1
//short_tp = isTPs and crossunder(low, (1 - tp / 100) * last_open_shortCondition) and 
   //shortCondition == 0 and in_shortCondition == 1

// Stop Loss

isSLl = input(true,"buy Loss Long")
//isSLs = input(false, "buy Loss Short")
sl = 0.0
sl := input(5, " rebuy %", type=input.float)
long_sl = isSLl and crossunder(low, (1 - sl / 100) * last_open_longCondition) and 
   longCondition == 0 and in_longCondition == 1
//short_sl = isSLs and crossover(high, (1 + sl / 100) * last_open_shortCondition) and 
   //shortCondition == 0 and in_shortCondition == 1

//
// Conditions

longCond5 = bool(na)
shortCond5 = bool(na)
longCond5 := longCondition
shortCond5 := long_tp

// 

sectionLongs5 = 0
sectionLongs5 := nz(sectionLongs5[1])
sectionShorts5 = 0
sectionShorts5 := nz(sectionShorts5[1])

if longCond5
    sectionLongs5 := sectionLongs5 + 1
    sectionShorts5 := 0
    sectionShorts5

if shortCond5
    sectionLongs5 := 0
    sectionShorts5 := sectionShorts5 + 1
    sectionShorts5

// 

pyr5 = 1


longCondition5 = longCond5 and sectionLongs5 <= pyr5
shortCondition5 = shortCond5 and sectionShorts5 <= pyr5

// Get the price of the last opened long or short

last_open_longCondition5 = float(na)
last_open_shortCondition5 = float(na)
last_open_longCondition5 := longCondition5 ? open : nz(last_open_longCondition5[1])
last_open_shortCondition5 := shortCondition5 ? open : nz(last_open_shortCondition5[1])

last_longCondition5 = float(na)
last_shortCondition5 = float(na)
last_longCondition5 := longCondition5 ? time : nz(last_longCondition5[1])
last_shortCondition5 := shortCondition5 ? time : nz(last_shortCondition5[1])

in_longCondition5 = last_longCondition5 > last_shortCondition5
in_shortCondition5 = last_shortCondition5 > last_longCondition5
//
filter=input(true)
g(v, p) => round(v * (pow(10, p))) / pow(10, p)
risk     = input(100)
leverage = input(1)
c = g((strategy.equity * leverage / open) * (risk / 100), 4)

//
l =(v1 > v2 or filter == false ) and longCondition or long_sl
//
//l = longCondition or long_sl
s=shortCondition5  
if l 
    strategy.entry("buy", strategy.long,c)
if s 
    strategy.entry("sell", strategy.short,c)


per(pcnt) =>
    strategy.position_size != 0 ? round(pcnt / 100 * strategy.position_avg_price / syminfo.mintick) : float(na)
stoploss=input(title=" stop loss", defval=5, minval=0.01)
los = per(stoploss)
q1=input(title=" qty_percent1", defval=50, minval=1)
q2=input(title=" qty_percent2", defval=50, minval=1)

tp10=input(title=" Take profit1", defval=1, minval=0.01)
tp20=input(title=" Take profit2", defval=2, minval=0.01)

strategy.exit("x1", qty_percent = q1, profit = per(tp10), loss = los)
strategy.exit("x2", qty_percent = q2, profit = per(tp20), loss = los)