Indicador de Momentum Estocástico e Estratégia de Negociação Quântica Baseada no RSI

Autora:ChaoZhang, Data: 2023-12-12 15:20:29
Tags:

img

Resumo

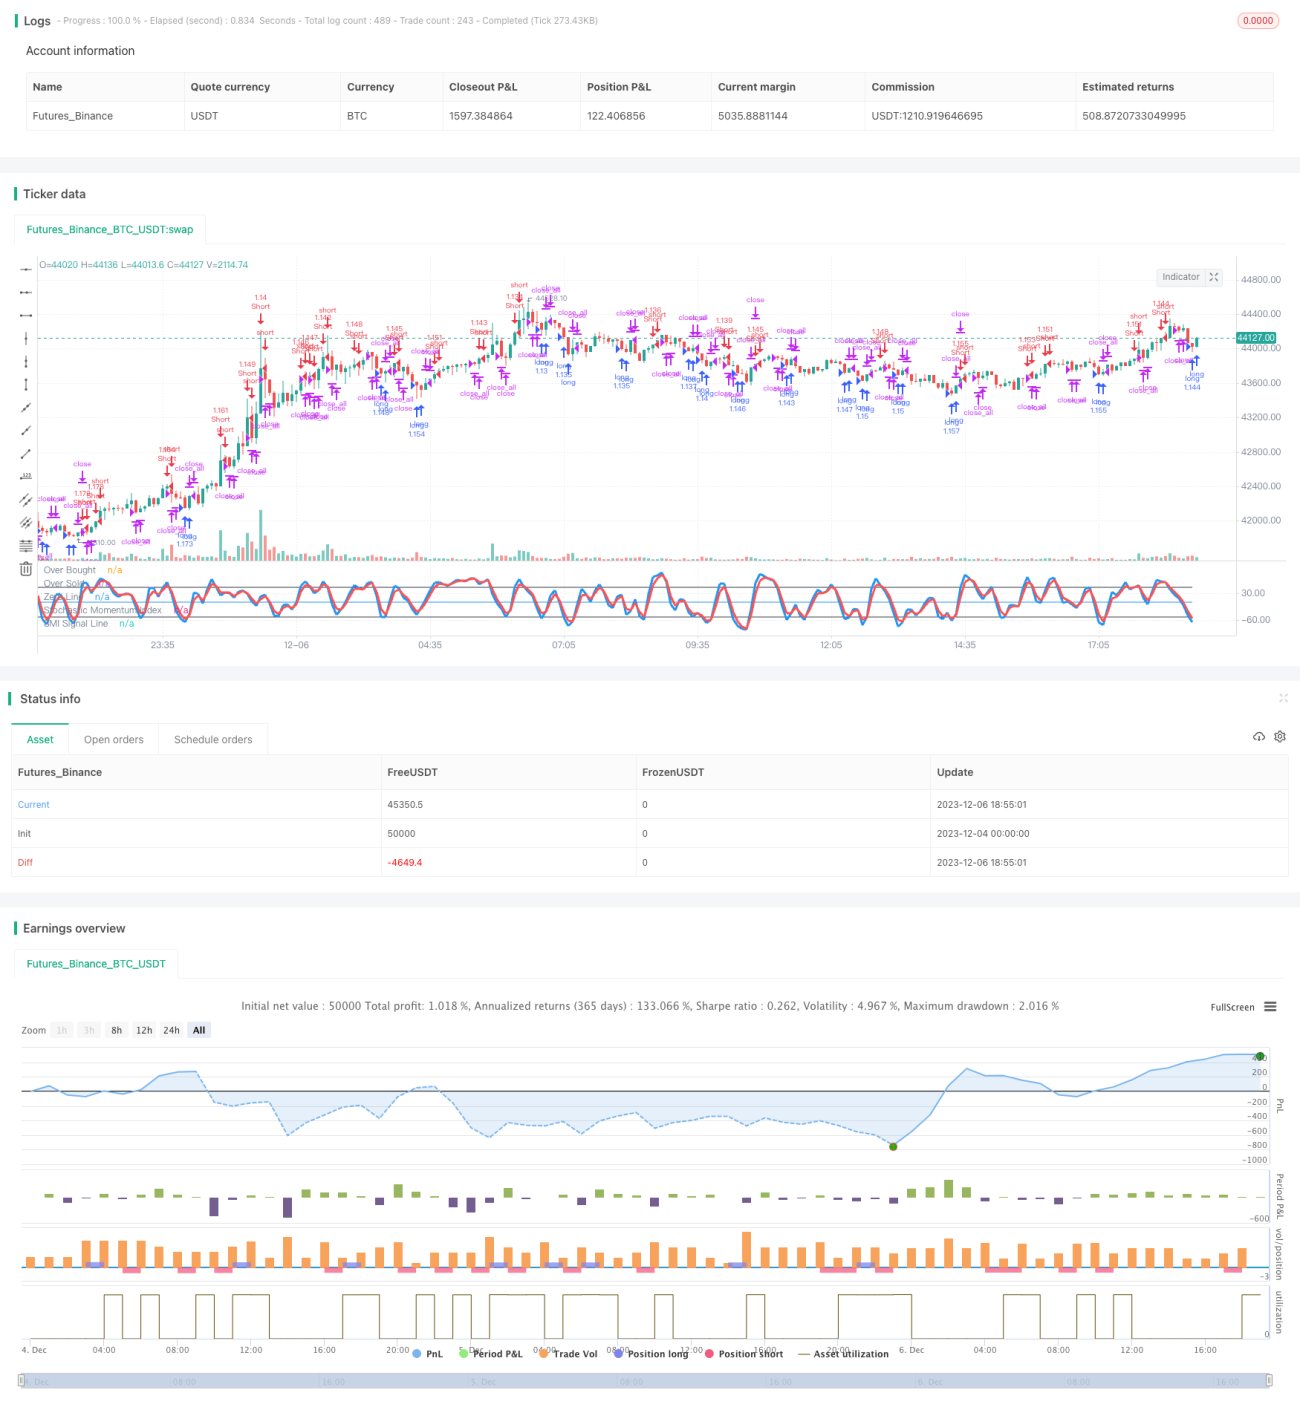
Esta estratégia é baseada principalmente em dois indicadores - Índice de Momento Estocástico (SMI) e Índice de Força Relativa (RSI). Também incorpora filtro de cor e filtro do corpo da vela como condições de julgamento auxiliares. Os sinais de negociação são gerados com base nos sinais de compra e venda do SMI e do RSI, combinados com condições de filtro. Esta estratégia pode efetivamente descobrir oportunidades de negociação de curto prazo no mercado.

Estratégia lógica

Esta estratégia baseia-se nos indicadores SMI e RSI para julgamento. O SMI julga principalmente se uma ação está sobrecomprada ou sobrevendida, enquanto o RSI determina a força relativa de uma ação. Quando ambos os indicadores dão sinais de compra ao mesmo tempo, uma ação de compra será desencadeada. A lógica específica é a seguinte:

  1. Quando o SMI é sobrevendido (abaixo do limite inferior), é considerado um sinal de compra
  2. Quando o RSI está abaixo do limiar, é considerado um sinal de compra
  3. Quando ocorrem tanto o SMI sobrevendido como o RSI abaixo do limiar correspondente, é desencadeado um sinal de compra
  4. A lógica do sinal de venda é semelhante

Além disso, esta estratégia possui um modo de sinais duplos. Este modo requer sinais SMI e RSI para desencadear quaisquer negociações. Isso pode efetivamente reduzir os falsos sinais.

Além disso, o filtro de cor e o filtro do corpo da vela são incorporados. Estes filtros exigem um corpo de vela relativamente grande e a última vela fechar mais alta do que aberta. Isso pode evitar ainda mais a troca de falhas.

Vantagens

  1. Utilize o SMI para sobrecompra/supervenda e o RSI para força relativa, a confirmação dupla pode reduzir os falsos sinais
  2. Modo de sinal duplo pode diminuir muito as negociações ineficazes
  3. Os filtros de cor e corpo podem filtrar os falsos surtos de forma eficaz
  4. A lógica da estratégia é simples e limpa.
  5. A maioria dos parâmetros é personalizável

Riscos e otimização

  1. SMI e RSI podem produzir mais sinais falsos quando utilizados sozinhos, necessitam de um exame cuidadoso
  2. No modo de sinal duplo, boas oportunidades de negociação podem ser perdidas se os parâmetros não forem definidos adequadamente
  3. Pode testar a rentabilidade da estratégia sob diferentes parâmetros periódicos para encontrar a combinação ótima de parâmetros
  4. Pode avaliar parâmetros limiares através de simulação ou backtesting
  5. Pode considerar incorporar mais filtros para otimizar a estratégia

Resumo

Esta estratégia integra os sinais de ambos os indicadores SMI e RSI e gera ordens de negociação através de confirmação dupla. Filtro de cor e filtro do corpo da vela também são implementados para filtrar falhas.


/*backtest
start: 2023-12-04 00:00:00
end: 2023-12-06 19:00:00
period: 5m
basePeriod: 1m
exchanges: [{"eid":"Futures_Binance","currency":"BTC_USDT"}]
*/

//Noro
//2018

//@version=2
strategy(title = "Noro's Stochastic Strategy v1.3", shorttitle = "Stochastic str 1.3", overlay = false, default_qty_type = strategy.percent_of_equity, default_qty_value = 100, pyramiding = 0)

//Settings 
needlong = input(true, defval = true, title = "Long")
needshort = input(true, defval = true, title = "Short")
usemar = input(false, defval = false, title = "Use Martingale")
capital = input(100, defval = 100, minval = 1, maxval = 10000, title = "Capital, %")
usesmi = input(true, defval = true, title = "Use SMI Strategy")
usersi = input(true, defval = true, title = "Use RSI Strategy")
usecol = input(true, defval = true, title = "Use Color-Filter")
usebod = input(true, defval = true, title = "Use Body-Filter")
a = input(2, defval = 2, minval = 2, maxval = 50, title = "SMI Percent K Length")
b = input(2, defval = 2, minval = 2, maxval = 50, title = "SMI Percent D Length")
limitsmi = input(50, defval = 50, minval = 1, maxval = 100, title = "SMI Limit")
periodrsi = input(2, defval = 2, minval = 2, maxval = 50, title = "RSI Period")
limitrsi = input(10, defval = 10, minval = 1, maxval = 50, title = "RSI Limit")
double = input(false, defval = false, title = "SMI+RSI Mode")
showbg = input(false, defval = false, title = "Show background")
fromyear = input(2018, defval = 2018, minval = 1900, maxval = 2100, title = "From Year")
toyear = input(2100, defval = 2100, minval = 1900, maxval = 2100, title = "To Year")
frommonth = input(01, defval = 01, minval = 01, maxval = 12, title = "From Month")
tomonth = input(12, defval = 12, minval = 01, maxval = 12, title = "To Month")
fromday = input(01, defval = 01, minval = 01, maxval = 31, title = "From day")
today = input(31, defval = 31, minval = 01, maxval = 31, title = "To day")

//Fast RSI
fastup = rma(max(change(close), 0), periodrsi)
fastdown = rma(-min(change(close), 0), periodrsi)
fastrsi = fastdown == 0 ? 100 : fastup == 0 ? 0 : 100 - (100 / (1 + fastup / fastdown))

//Stochastic Momentum Index
ll = lowest (low, a)
hh = highest (high, a)
diff = hh - ll
rdiff = close - (hh+ll)/2
//avgrel = ema(ema(rdiff,b),b)
//avgdiff = ema(ema(diff,b),b)
avgrel = sma(sma(rdiff,b),b)
avgdiff = sma(sma(diff,b),b)
SMI = avgdiff != 0 ? (avgrel/(avgdiff/2)*100) : 0
SMIsignal = ema(SMI,b)

//Lines
plot(SMI, color = blue, linewidth = 3, title = "Stochastic Momentum Index")
plot(SMIsignal, color = red, linewidth = 3, title = "SMI Signal Line")
plot(limitsmi, color = black, title = "Over Bought")
plot(-1 * limitsmi, color = black, title = "Over Sold")
plot(0, color = blue, title = "Zero Line")

//Color-Filter
gb = close > open or usecol == false
rb = close < open or usecol == false

//Body Filter
nbody = abs(close - open)
abody = sma(nbody, 10)
body = nbody > abody / 3 or usebod == false

//Signals
up1 = SMI < -1 * limitsmi and rb and body and usesmi
dn1 = SMI > limitsmi and gb and body and usesmi
up2 = fastrsi < limitrsi and rb and body and usersi
dn2 = fastrsi > 100 - limitrsi and gb and body and usersi
exit = ((strategy.position_size > 0 and close > open) or (strategy.position_size < 0 and close < open)) and body

//Background
redb = (SMI > limitsmi and usesmi) or (fastrsi > 100 - limitrsi and usersi)
limeb = (SMI < -1 * limitsmi and usesmi) or (fastrsi < limitrsi and usersi)
col = showbg == false ? na : redb ? red : limeb ? lime : na
bgcolor(col, transp = 50)

//Trading
profit = exit ? ((strategy.position_size > 0 and close > strategy.position_avg_price) or (strategy.position_size < 0 and close < strategy.position_avg_price)) ? 1 : -1 : profit[1]
mult = usemar ? exit ? profit == -1 ? mult[1] * 2 : 1 : mult[1] : 1
lot = strategy.position_size == 0 ? strategy.equity / close * capital / 100 * mult : lot[1]

signalup = ((up1 or up2) and double == false) or (up1 and up2 and double)
if signalup
    if strategy.position_size < 0
        strategy.close_all()
        
    strategy.entry("long", strategy.long, needlong == false ? 0 : lot, when=(time > timestamp(fromyear, frommonth, fromday, 00, 00) and time < timestamp(toyear, tomonth, today, 23, 59)))

signaldn = ((dn1 or dn2) and double == false) or (dn1 and dn2 and double)
if signaldn
    if strategy.position_size > 0
        strategy.close_all()
        
    strategy.entry("Short", strategy.short, needshort == false ? 0 : lot, when=(time > timestamp(fromyear, frommonth, fromday, 00, 00) and time < timestamp(toyear, tomonth, today, 23, 59)))
    
if time > timestamp(toyear, tomonth, today, 23, 59) or exit
    strategy.close_all()

Mais.