Estratégia de acompanhamento de tendência de reversão dupla

Visão geral
Trata-se de uma estratégia de acompanhamento de tendências que combina dois sinais de reversão. Integra a estratégia de reversão 123 e a estratégia de índice de desempenho para rastrear os pontos de reversão de preços e obter um julgamento de tendências mais confiável.
Princípio da estratégia
A estratégia é composta por duas sub-estratégias:
-
123 estratégia de reversão
A linha K de 14 dias é usada para avaliar sinais de inversão. As regras são:
- Sinais múltiplos: Preço de fechamento dos dois primeiros dias caiu, o fechamento atual da linha K está acima do fechamento do dia anterior, o Stochastic Slow do dia 9 está abaixo de 50
- Sinal de cabeça vazia: Preço de fechamento dos dois primeiros dias aumentou, o fechamento atual da linha K está abaixo do fechamento do dia anterior, o Stochastic Fast do dia 9 está acima de 50
-
Estratégias de índice de desempenho
A regra é a seguinte:
- Índice de desempenho> ((0)), produzindo um sinal de múltiplas cabeças
- Índice de desempenho <(0), gerando um sinal de cabeceira vazia
O sinal final é a combinação de dois tipos de sinais. É necessário um sinal de multi-espaço de direção semelhante para produzir uma operação de compra e venda real.
Isso pode filtrar parte do ruído, tornando o sinal mais confiável.
Vantagens estratégicas
O sistema de dupla inversão tem as seguintes vantagens:
- A combinação de dois fatores torna os sinais mais confiáveis
- Filtrar o ruído do mercado para evitar falsos sinais
- 123 forma clássica e prática, fácil de julgar e reproduzir
- Os índices de desempenho podem determinar as tendências futuras
- A combinação de parâmetros é flexível e pode ser melhorada
Risco estratégico
A estratégia também apresenta alguns riscos:
- A tendência é de que os preços dos produtos e serviços sejam mais baixos do que os preços dos produtos e serviços.
- Combinação de duplas condições leva a menos sinais e pode afetar a lucratividade
- Precisa de julgamento empírico e é vulnerável a flutuações especiais de ações individuais
- Problemas de configuração de parâmetros podem causar distorção de sinal
As melhorias que podem ser consideradas são:
- Ajustar parâmetros, como K-length, ciclo estocástico, etc.
- Optimizar a lógica de julgamento de sinais duplos
- Combinação de mais fatores, como o volume de transações.
- Aumentar o mecanismo de suspensão de perdas
Resumir
A estratégia integra o julgamento de dupla reversão e é eficaz na detecção de pontos de reversão de preços. Embora a probabilidade de ocorrência de sinais seja menor, a confiabilidade é alta e é adequada para capturar tendências de linha média e longa. A eficácia da estratégia pode ser aumentada ainda mais por meio de ajustes de parâmetros e otimização de múltiplos fatores.
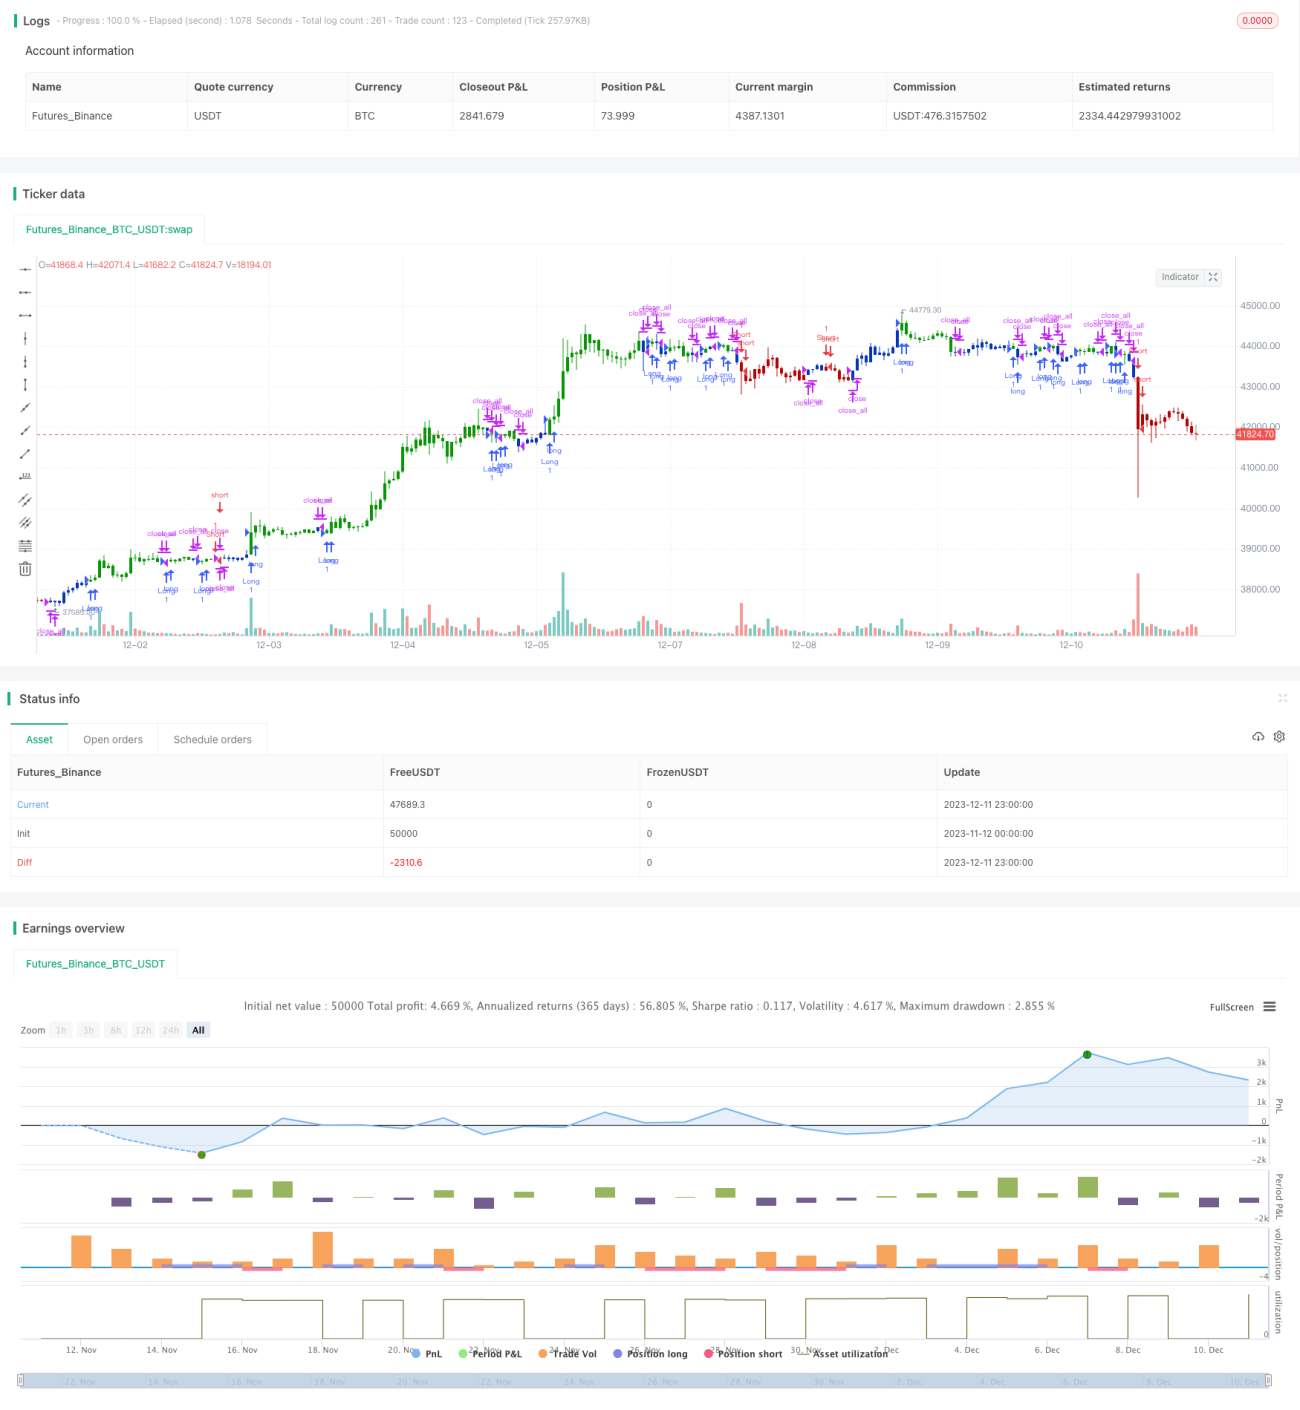
/*backtest
start: 2023-11-12 00:00:00
end: 2023-12-12 00:00:00
period: 1h
basePeriod: 15m
exchanges: [{"eid":"Futures_Binance","currency":"BTC_USDT"}]
*/

//@version=4
////////////////////////////////////////////////////////////
//  Copyright by HPotter v1.0 15/04/2021
// This is combo strategies for get a cumulative signal. - 1